AI-Dentify: التعلم العميق للكشف عن تسوس الأسنان القريب في أشعة إكس للعضة – دراسة HUNT4 لصحة الفم AI-Dentify: deep learning for proximal caries detection on bitewing x-ray – HUNT4 Oral Health Study

المجلة: BMC Oral Health، المجلد: 24، العدد: 1
DOI: https://doi.org/10.1186/s12903-024-04120-0
PMID: https://pubmed.ncbi.nlm.nih.gov/38494481
تاريخ النشر: 2024-03-18

AI-Dentify: التعلم العميق للكشف عن تسوس الأسنان القريب في أشعة إكس للعضة – دراسة HUNT4 لصحة الفم

خافيير بيريز دي فروس , راغنهيلد هولدن هيلاند , شريا ديساي , لاين كاثرين نيموين , توماس لانغø , ثيودور ريمان و أبهيدجيت سين

الملخص

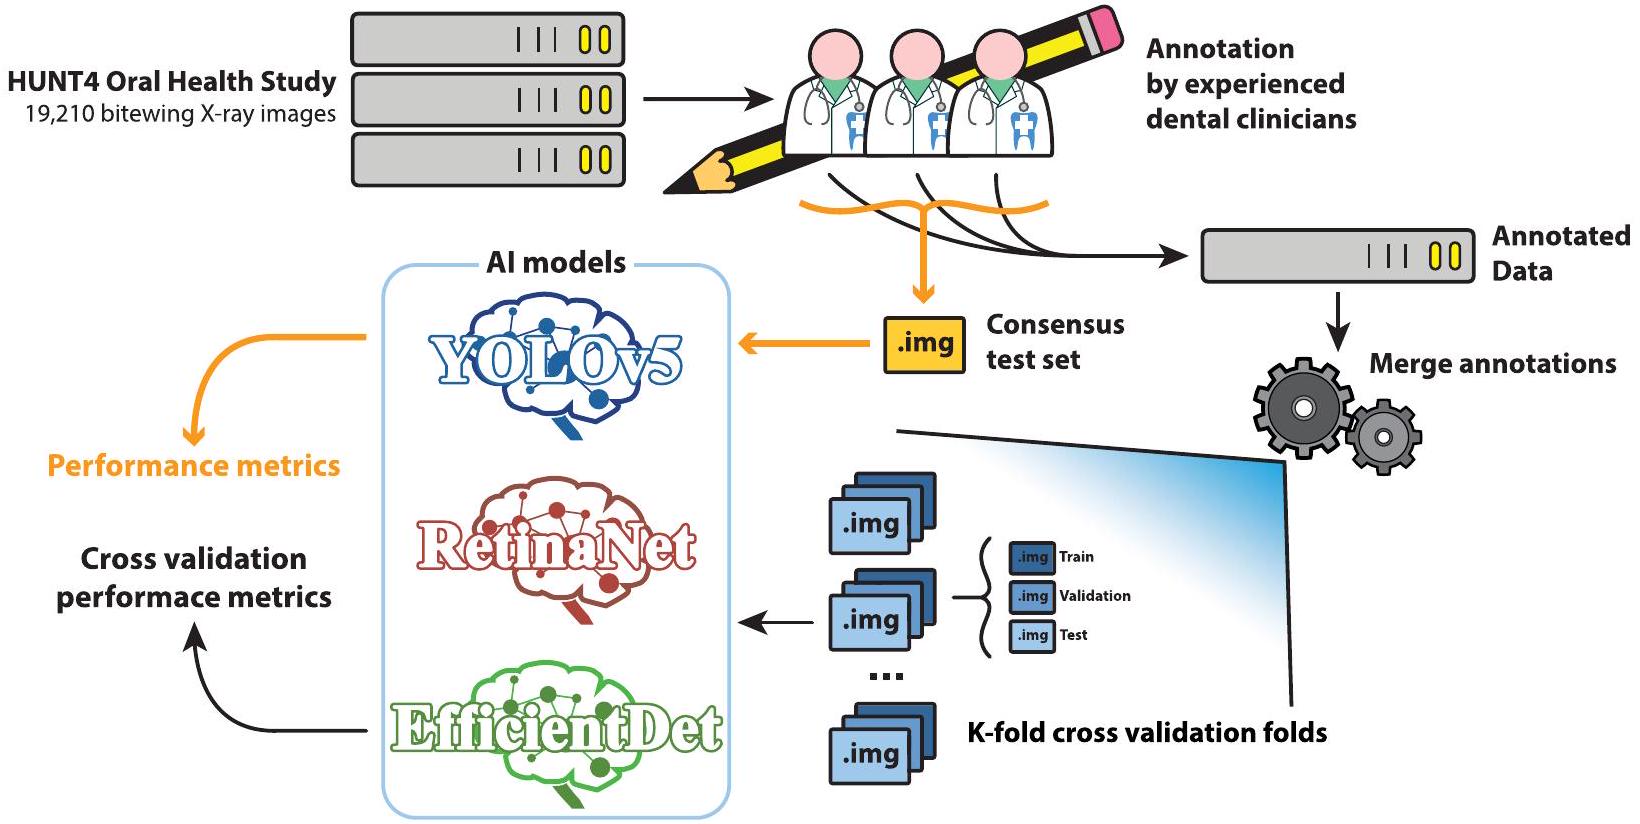
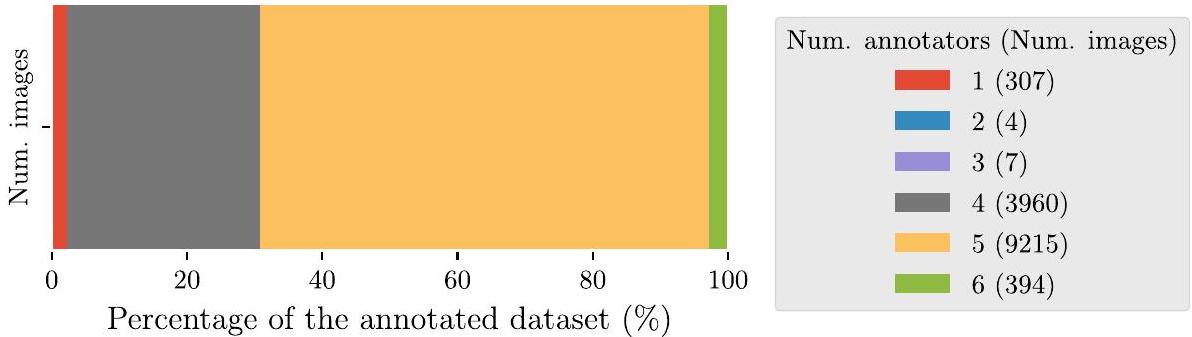
الخلفية يتطلب تشخيص تسوس الأسنان الفحص اليدوي لصور الأشعة السينية التشخيصية للمرضى، يليه فحص بصري واستكشاف للأجزاء السنية المحددة التي تحتوي على آفات محتملة. ومع ذلك، فإن استخدام الذكاء الاصطناعي، وخاصة التعلم العميق، لديه القدرة على المساعدة في التشخيص من خلال تقديم تحليل سريع ومعلوماتي لصور الأشعة السينية. الطرق تم وضع مجموعة بيانات تحتوي على 13,887 صورة أشعة سينية من دراسة HUNT4 لصحة الفم، وتمت الإشارة إليها بشكل فردي من قبل ستة خبراء مختلفين، واستخدمت لتدريب ثلاث هياكل مختلفة للكشف عن الأجسام باستخدام التعلم العميق: RetinaNet (ResNet50)، YOLOv5 (حجم M)، و EfficientDet (حجم D0 و D1). تم استخدام مجموعة بيانات توافقية تحتوي على 197 صورة، تم الإشارة إليها بشكل مشترك من قبل نفس الستة من أطباء الأسنان، للتقييم. تم استخدام نظام التحقق المتقاطع بخمسة أضعاف لتقييم أداء نماذج الذكاء الاصطناعي.

النتائج تظهر النماذج المدربة زيادة في الدقة المتوسطة ودرجة F1، وانخفاض في معدل السلبية الكاذبة، بالنسبة لأطباء الأسنان. عند مقارنتها بأطباء الأسنان، يظهر نموذج YOLOv5 أكبر تحسين، حيث سجل 0.647 دقة متوسطة، 0.548 درجة F1 متوسطة، و 0.149 معدل سلبية كاذبة متوسطة. بينما أبلغ أفضل المعلقين عن كل من هذه المقاييس , و 0.164 على التوالي. الاستنتاج أظهرت نماذج التعلم العميق القدرة على مساعدة المتخصصين في طب الأسنان في تشخيص التسوس. ومع ذلك، تظل المهمة صعبة بسبب العيوب الطبيعية في صور الأشعة السينية.

الكلمات الرئيسية الكشف عن التسوس، الأشعة السينية، طب الأسنان الرقمي، التعلم العميق، الكشف عن الأجسام
*المراسلة:
خافيير بيريز دي فروس
javier.perezdefrutos@sintef.no
قسم أبحاث الصحة، SINTEF Digital، شارع بروكس 2، تروندهايم 7030، النرويج
Boneprox A.B.، غوتنبرغ، السويد
Boneprox A.S.، تونسبيرغ، النرويج
قسم الصحة العامة والتمريض، الجامعة النرويجية للعلوم والتكنولوجيا، تروندهايم، النرويج
Kompetansesenteret Tannhelse Midt (TkMidt)، تروندهايم، النرويج

المقدمة

كما ورد في تقرير حالة الصحة الفموية العالمية لمنظمة الصحة العالمية في عام 2022 [1]، يعاني 3.5 مليار شخص على مستوى العالم من شكل من أشكال الأمراض الفموية، و2 مليار يعانون من التسوس في الأسنان الدائمة. علاوة على ذلك، فإن التسوس غير المعالج في الأسنان الدائمة هو أكثر حالات صحة الأسنان شيوعًا. يتطلب تشخيص مثل هذه الآفات فحص الصور السريرية مثل الأشعة السينية (صور ثنائية الأبعاد) أو التصوير المقطعي المحوسب باستخدام شعاع مخروط (صور ثلاثية الأبعاد)، بالإضافة إلى الفحص البصري واستكشاف الأسنان المتأثرة. هذه العملية تستغرق وقتًا طويلاً، وتتطلب مستوى عالٍ من الخبرة
عند تحليل الصور السريرية. يتم استخدام نوعين رئيسيين من الصور لمساعدة ودعم فحص التسوس وهما الأشعة السينية (BW) والأشعة السينية البانورامية (OPG) [2، 3]. التسوس، وخاصة التسوس القريب، وهو نوع من الآفات التسوسية الموجودة على الأسطح بين الأسنان المجاورة، يصعب اكتشافه يدويًا أو بصريًا (أي باستخدام صور الأشعة السينية) بسبب العيوب. أيضًا، يمكن أن تعيق الزاوية السيئة التعرف الصحيح على الآفات أو حتى تحجب التسوسات الأقل درجة.
منذ عام 2008، زادت الأبحاث حول تطبيق الذكاء الاصطناعي (AI) و، بشكل أكثر تحديدًا، نماذج الشبكات العصبية التلافيفية (CNN) للتعلم العميق (DL) لتحليل الأسنان بشكل ملحوظ [4-13]. ومع ذلك، لا تزال الأبحاث في هذا المجال محدودة مقارنةً بالمجالات السريرية الأخرى. توفر البيانات والتعليقات الموثوقة [8، 13] هي العقبات الرئيسية في تطوير طرق التعلم الآلي (ML) في طب الأسنان. تستخدم نسبة كبيرة من الأعمال المنشورة مجموعة بيانات تحتوي على أقل من 300 صورة، فقط عدد قليل من الدراسات لديها وصول إلى مجموعات بيانات كبيرة [8] تحتوي على أكثر من 1,000 صورة مثل [11، 14، 15]. من بين هذه المنشورات، تركز الأعمال المقدمة في [4 على الكشف عن الأجسام، وهو نطاق الدراسة الحالية. يشير الكشف عن الأجسام أو التعرف على الأجسام إلى مهمة تحديد وتصنيف الأجسام في صورة [16]. يتم عادةً تحديد الموقع باستخدام صناديق محاطة بمحاور، تحيط بأقصى حدود للعنصر المعني.
في Devito et al. [4]، تم استخدام شبكة عصبية متعددة الطبقات تحتوي على 51 خلية عصبية اصطناعية (25 في طبقة الإدخال، 25 في الطبقة المخفية، وواحدة في طبقة الإخراج) للكشف عن التسوس القريب في صور الأشعة السينية، باستخدام مجموعة بيانات تحتوي على 160 صورة تم الإشارة إليها من قبل 25 خبيرًا. بينما في Srivastava et al. [11]، تم تدريب كاشف التسوس باستخدام شبكة عصبية متصلة بالكامل مصممة خصيصًا مع 3,000 صورة أشعة سينية تم الإشارة إليها. في Singh et al. [6]، تم بناء ميزات مصنوعة يدويًا لصور الأشعة السينية باستخدام تحويلات رادون وتحويلات كوسينوس منفصلة، وتم تصنيفها لاحقًا باستخدام مجموعة من تقنيات التعلم الآلي مثل الغابة العشوائية. اقترح Park et al. [15] مجموعة من U-Net و Fast R-CNN للكشف عن التسوس في صورة ملونة، تم تدريبها باستخدام 2,348 صورة فوتوغرافية داخل الفم RGB. على الرغم من أن العمل الذي قام به Cantu et al. [14] يركز على تقسيم الصور، إلا أنه يستحق الذكر بسبب مجموعة البيانات المستخدمة: 3,686 صورة أشعة سينية، مع تعليقات تقسيم التسوس، لتدريب نموذج U-Net للتقسيم.

أهداف الدراسة

في هذه الدراسة نقارن بين ثلاث هياكل متقدمة للتعلم العميق للكشف عن الأجسام في مهمة الكشف عن التسوس القريب، وهي RetinaNet و YOLOv5 و EfficientDet. من خلال استخدام مجموعة بيانات موسعة ومشروحة، افترضنا أن نماذج الكشف عن الأجسام باستخدام الذكاء الاصطناعي يمكن أن تؤدي بنفس الشروط أو أفضل من أطباء الأسنان
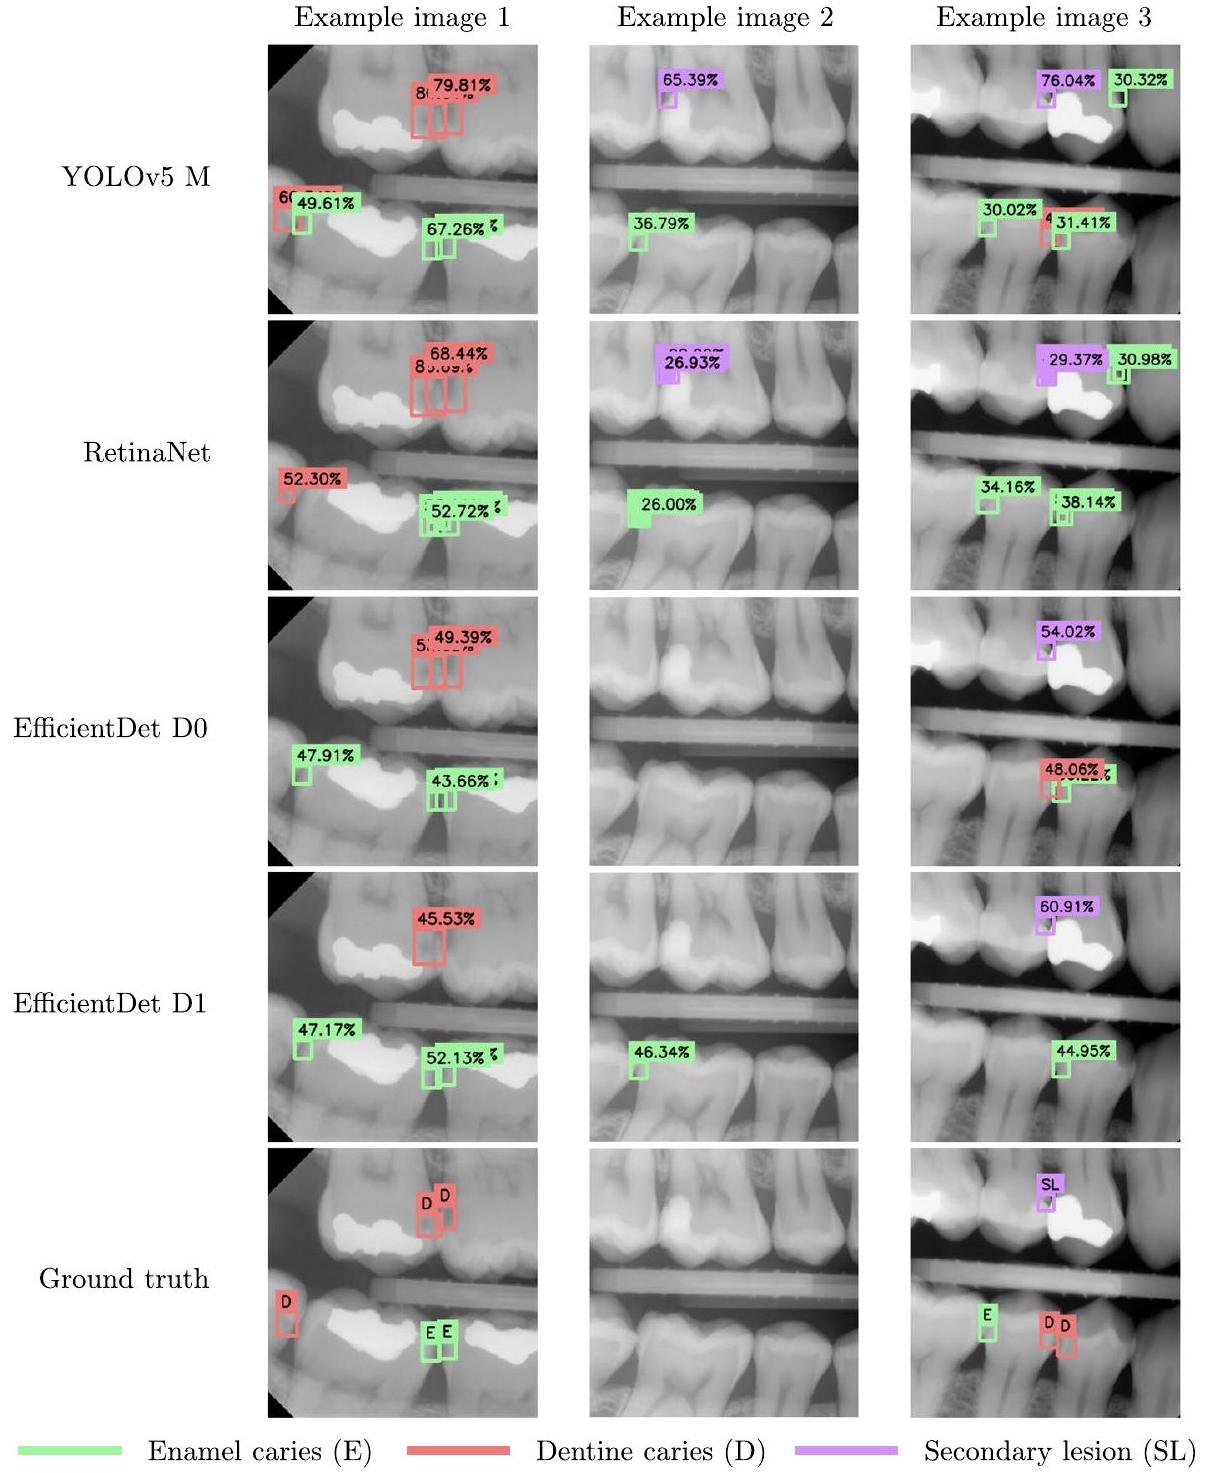
لذا، في هذه الدراسة قمنا بتدريب الهياكل المذكورة أعلاه في الكشف وتصنيف تسوس المينا، تسوس العاج، والآفات الثانوية، في صور الأشعة السينية. ثم تمت مقارنة النماذج مع المعلقين البشريين لاختبار فرضيتنا. بالإضافة إلى ذلك، تم اقتراح خط أنابيب معالجة جديد لدمج تعليقات الكشف عن الأجسام متعددة المراقبين، استنادًا إلى نماذج المزيج الغاوسي.

الطرق

مجموعة البيانات

تم جمع صور الأشعة السينية المستخدمة في هذه الدراسة كجزء من دراسة HUNT4 لصحة الفم حول انتشار التهاب اللثة في السكان النرويجيين، وهي دراسة فرعية من المرحلة الرابعة لدراسة HUNT [17]. دراسة HUNT4 لصحة الفم هي دراسة تعاونية بين عدة معاهد نرويجية بما في ذلك: مركز أبحاث HUNT، Kompetansesenteret Tannhelse Midt (TkMidt)، الجامعة النرويجية للعلوم والتكنولوجيا (NTNU)، جامعة أوسلو (UiO)، مركز Kompetansesenteret Tannhelsetjenestens Øst (TkØ)، والمركز الوطني النرويجي للشيخوخة والصحة.
تتكون البيانات المجمعة من الفحص السريري والإشعاعي الفموي، الذي تم بين عامي 2017 و 2019. تم دعوة 7,347 مشاركًا للمشاركة في الدراسة، من أصل 137,233 شخصًا (2017) [18]. تم تضمين 4,933 مشاركًا فقط في دراسة مسح صحة الفم، من بينهم، أكمل 4,913 كل من الفحص السريري والإشعاعي [18، 19]. تم جمع ما مجموعه 19,210 صورة أشعة سينية و 4,871 صورة OPG من المشاركين. أظهرت التركيبة السكانية لمجموعة البيانات توزيعًا من الإناث و 2,174 ( ) من الذكور، تتراوح أعمارهم بين 19 و 94 عامًا ( عامًا في المتوسط) [18]. لهذه الدراسة، تم اعتبار صور الأشعة السينية فقط.
ستصف الأقسام الفرعية التالية خطوات سير العمل المتبعة في الدراسة الحالية، كما هو موضح في الشكل 1.

توضيح البيانات

تم توضيح البيانات من قبل ستة أطباء أسنان ذوي خبرة واسعة في تشخيص التسوس القريب، باستخدام أداة التوضيح مفتوحة المصدر AnnotationWeb [20]. تم تصنيف التسوس إلى خمس فئات مختلفة كما هو موضح في الجدول 1. يمكن العثور على مزيد من التفاصيل حول إجراء التوضيح في القسم 1 من المواد الإضافية 1.
لتنظيف التعليقات التوضيحية من أجل الحصول على حقيقة أرضية لتدريب نماذج الذكاء الاصطناعي، تم تصور استراتيجية جديدة لدمج تعليقات المراقبين المتعددين في اكتشاف الكائنات لهذا المشروع. أولاً، تم تجميع صناديق الحدود المعلّمة بناءً على درجة التقاطع على الاتحاد (IoU)، وهي مقياس يصف مدى جودة
الشكل 1 سير عمل البيانات. تم تخزين صور الأشعة السينية للأسنان من دراسة صحة الفم HUNT4 على خادم مخصص، وتم إتاحتها لأطباء الأسنان وخبراء صحة الفم للتعليق، مما أدى إلى الحصول على البيانات المعلّقة ومجموعة اختبار الإجماع. تم دمج التعليقات الناتجة لبناء مجموعات البيانات المستخدمة في هذه الدراسة. تم تقسيم مجموعة بيانات التدريب بشكل إضافي وفقًا لتقنية K-fold (في هذه الدراسة K = 5) للتحقق المتقاطع (CV)، وتمت معالجتها مسبقًا. تم تدريب نماذج الذكاء الاصطناعي وتقييمها على كل من مجموعة اختبار CV ومجموعة اختبار الإجماع.
الجدول 1 تعريف الفئات المستخدمة لتوضيح مجموعة البيانات
اسم الملصق وصف
الصف الأول شفاف إشعاعيًا في النصف الخارجي من المينا [21، 22]
الصف الثاني شفاف شعاعياً في النصف الداخلي من المينا، ولكن ليس في العاج [21،22]
الصف الثالث شفاف شعاعياً في الثلث الخارجي من العاج [21،22]
الصف الرابع شفاف شعاعيًا في ثلثي العاج [21،22]
الصف الخامس شفاف إشعاعيًا في الثلث الداخلي من العاج [21، 22]
آفة ثانوية تسوس الأسنان المرتبط بالسدادات أو الترميمات
درجة غير معروفة تسوس الأسنان الذي لا يمكن تحديد درجته بوضوح
تتداخل الصناديق. ثم، تم ملاءمة توزيع غاوسي لكل صندوق محيط في المجموعة، على المحاور الرأسية والأفقية. تم الحصول على دالة كثافة مختلطة (MDF) لنموذج خليط غاوسي حيث تمتلك جميع التوزيعات نفس الوزن، من خلال دمج دوال كثافة الاحتمال للتوزيعات الغاوسية الملائمة. ثم تم الحصول على صندوق المحيط المشترك من MDF مع وجود عتبة احتمالية. كما هو موضح في الخوارزمية 2، في المواد الإضافية 1. بدلاً من ذلك، يمكن استخدام خوارزمية قمع القيم غير القصوى (NMS) للعثور على أفضل صندوق محيط مناسب. ومع ذلك، نظرًا لأن جميع التعليقات التوضيحية كانت لها نفس مستوى الثقة، على عكس التوقعات التي قامت بها نموذج الذكاء الاصطناعي، فإن NMS سيكون متحيزًا نحو أول صندوق محيط تم اختياره كـ
مرجع. أخيرًا، تم تحديد تسمية صندوق الربط المشترك بناءً على أكثر الفئات تصويتًا بين صناديق الربط في المجموعة. في حالة التعادل، تم اختيار الفئة الأكثر خطورة مثل تسوس العاج على تسوس المينا.
تمت إضافة تعليقات على إجمالي 13,887 صورة بواسطة واحد إلى ستة من أطباء الأسنان (انظر الشكل 2)، حيث تم إضافة تعليقات على إجمالي 13,585 صورة بواسطة أكثر من طبيب أسنان واحد.
تظهر توزيع الملصقات في الشكل 3 حجمًا أكبر من الآفات الثانوية مقارنة بجميع الدرجات الأخرى. بعد المناقشة مع أطباء الأسنان، تم الاتفاق على دمج الدرجة الأولى والثانية تحت ملصق “تسوس المينا”، والدرجات من الثالثة إلى الخامسة تحت مجموعة “تسوس العاج”. تم الاحتفاظ بتسوس الأسنان الثانوي ومجموعات الدرجات غير المعروفة كفئات ملصقات منفصلة.
بالإضافة إلى ذلك، تم وضع علامات على 197 صورة من خلال اتفاق بالإجماع بين جميع المعلقين الخبراء، وذلك لبناء مجموعة اختبار لأغراض التقييم. لإنشاء هذه المجموعة، التي ستعرف لاحقًا بمجموعة اختبار الإجماع، تم جمع جميع المعلقين (أطباء الأسنان) في نفس الغرفة وتم التوصل إلى اتفاق بالإجماع بشأن وضع علامات على الصور. كانت الصور في مجموعة اختبار الإجماع قد تم وضع علامات عليها سابقًا من قبل جميع المعلقين بشكل فردي، مع وجود فجوة زمنية كبيرة بين التعليقات الفردية وإنشاء تعليقات اتفاق الإجماع، بحيث يمكن اعتبار التعليقات مستقلة عن بعضها البعض.
الشكل 2 توزيع الصور المعلّمة في مجموعة البيانات المعلّمة. في الأسطورة، يتم عرض عدد الصور المعلّمة لكل فترة داخل الأقواس.
الشكل 3 توزيع التعليقات في مجموعة البيانات التي تم التعليق عليها بواسطة ستة أطباء أسنان. تم تصوير تسوس المينا القريب (الدرجات 1 و 2، إجمالي 19,995 تعليق) باللون الأخضر الفاتح، بينما تم تصوير آفات العاج (الدرجات 3 إلى 5، إجمالي 17,903 تعليق) باللون البرتقالي، وتم تصوير الآفات الثانوية باللون الوردي، وتم تمييز التسوس غير المؤكد باللون الأبيض. الصور الخالية من الآفات (لا تسوس) تظهر باللون الأزرق الداكن، وهنا يتطابق عدد التعليقات مع عدد الصور.

نماذج كشف الكائنات

تم تقييم ثلاث هياكل متطورة لاكتشاف الكائنات للكشف عن التسوس: RetinaNet (تنفيذ Keras) [23] (هيكل ResNet50)، YOLOv5 [24] (الحجم M)، و EfficientDet [25] (مدرب مسبقًا D0 و D1). استخدمت جميع النماذج التعلم بالنقل، وهي استراتيجية شائعة عند تكييف نماذج اكتشاف الكائنات مع مجموعة بيانات معينة، من خلال تحميل أوزان النماذج المدربة على مجموعة بيانات أكبر مثل ImageNet أو مجموعات بيانات COCO. تم تهيئة RetinaNet بأوزان ResNet50 المدربة على مجموعة بيانات ImageNet، بينما قامت YOLOv5 بتحميل الأوزان المدربة مسبقًا على مجموعة بيانات COCO (المقدمة في المستودع الأصلي).https://github.com/ultralytics/yolov5)، وتم الحصول على أوزان EfficientDet المدربة مسبقًا من https://github.com/rwightman/efficientdet-pytorchلتحسين مقارنة الهياكل، يوضح الجدول 2 عدد المعلمات لكل هيكل. بسبب قيود الوقت، لم يتم تضمين جميع إصدارات YOLOv5 و EfficientDet في النتائج الحالية. تم الحفاظ على نفس المعالجة المسبقة والمعالجة اللاحقة لجميع النماذج والتجارب. تم إجراء تجارب أولية باستخدام هيستوغرام التكيف المحدود بالتباين.
الجدول 2 عدد المعلمات لكل بنية
العمارة عدد المعلمات (ملايين)
YOLOv5 M 21.2 مليون
ريتنا نت (ResNet50) 36.4 مليون
EfficientDet D0 3.9 مليون
EfficientDet D1 M 6.6 مليون
طريقة التوحيد (CLAHE)، مستوحاة من جورجييفا وآخرون [26]، ولكن تم استبعاد هذه التجارب قبل الجولة النهائية من التحقق المتبادل لأنها لم تؤد إلى أي تحسين في الدرجات. فقط تم توحيد الشدة إلى النطاق تم استخدام التدوير الأفقي والرأسي لزيادة مجموعة بيانات التدريب، حيث تم تطبيق كلاهما باحتمالية 0.5.
تم التدريب على خادم مخصص يعمل بنظام أوبونتو 20.04. كانت الآلة مزودة ببطاقة رسومات NVidia Quadro RTX 5000 بسعة 16 جيجابايت من الذاكرة العشوائية، ومعالج Intel Core i7-9700، وذاكرة RAM بسعة 32 جيجابايت، وقرص SSD بسعة 1 تيرابايت، وقرص HDD بسعة 8 تيرابايت. التدريب
تم تلخيص المعلمات لكل نموذج في الجدول 3. في حالة YOLOv5 و RetinaNet، تم مراقبة معدل التعلم باستخدام جدولة معدل التعلم. بالنسبة لـ YOLOv5، تم استخدام جدولة OneCycleLR من PyTorch مع معدل تعلم أقصى قدره . بينما تم استخدام جدولة معدل التعلم خطوة ل RetinaNet مع ضبط الصبر على 10 عصور. بالنسبة لكل من RetinaNet و EfficientDet، تم استخدام موقِف مبكر لمنع الإفراط في التكيف. كان الصبر 20 وزيادة الحد الأدنى للخسارة تم تكوينه لـ RetinaNet، وصبر لمدة 50 وزيادة دنيا من لـ EfficientDet.

بروتوكول التحقق

بعد إزالة الصور التي تم رفضها من قبل المعلقين (980)، الصور ذات التقييمات غير المعروفة ، وأولئك في مجموعة بيانات اختبار الإجماع (197)، تم تقسيم الصور المتبقية البالغ عددها 8,342 إلى خمسة طيات لإجراء دراسة التحقق المتقاطع (CV). تم استخدام العينة العشوائية بدون استبدال لبناء الطيات. تم إجراء تدريب وتقييم التحقق المتقاطع باستخدام تقسيم ثلاثي، أي أنه في كل تكرار، تم استخدام ثلاث طيات للتدريب، وطية واحدة للاختبار أثناء التدريب، لتجنب الإفراط في التكيف؛ وتم الاحتفاظ بالطية النهائية جانبًا كمجموعة اختبار للتقييم النهائي للأداء.
لاختبار فرضيتنا حول أداء نماذج الذكاء الاصطناعي، تم تقييم كل من النماذج المدربة في كل طية والمُعَلقين مقابل مجموعة اختبار الإجماع. ومع ذلك، بسبب قيود الوقت، لم يكمل أحد المُعَلقين مهمة التوصيف الفردية، حيث فاته صورة واحدة، وبالتالي فإن المقاييس الناتجة عن هذا المُعَلق ليست قابلة للمقارنة بشكل صارم مع تلك الخاصة بالنماذج.
والمعقبين الآخرين. يتم تمييز هذا المعقب بنجمة (*) في الجدول 7.

تقييم الأداء

كما ذُكر سابقًا، تم تقييم النماذج الموضحة في قسم “نماذج كشف الكائنات” والمُعَلقين على مجموعة اختبار التوافق. كانت المقاييس المستخدمة في التقييم هي المقاييس القياسية لتقييم أداء نماذج كشف الكائنات: الدقة المتوسطة (AP) لكل من الفئات، ومتوسط الدقة المتوسطة (mAP) عبر الفئات، ودرجة F1 (F1) لكل من الفئات، ومتوسط درجة F1 (mF1) كبديل لاسترجاع الدقة، ومعدل السلبية الكاذبة (FNR) لكل فئة، والمتوسط عبر الفئات (mFNR). هذه المقاييس الثلاثة تقع ضمن النطاق .
تم حساب فترات الثقة باستخدام طريقة Bootstrap (95%) لنتائج الاختبارات لكل من النماذج والمعلقين، لمقارنة أدائهم. لهذه المقارنة، تم تدريب النماذج على تم استخدام الطيات. تم حساب الفترات باستخدام خوارزمية البوتستراب المصححة والمنشطة [27]، مع 1,000 تكرار لفترة الثقة. تم تحديد الأهمية في اختلافات الدرجات بين المعلقين والنماذج بناءً على تداخل فترات الثقة.

النتائج

يمكن العثور على نتائج التقييم لمجموعة الاختبار التوافقية لعملية التحقق المتقاطع بخمس طيات في الجداول 4 و 5 و 6 (يمكن العثور على النتائج لكل طية في الجدول 1 في القسم 4 من المواد الإضافية 1). تم حساب المقاييس باستخدام مقاييس PASCAL VOC المطبقة في [28]، مع عتبة IoU تبلغ 0.3. وقد اعتُبرت هذه العتبة توازنًا مناسبًا بين
الجدول 3 معلمات التدريب لكل نموذج
العمارة حجم الدفعة معدل التعلم الحد الأقصى من العصور محسّن إطار عمل
YOLOv5 M ٨ 180 دولار سنغافوري بايتورتش
ريتنا نت ٤ ٢٠٠ آدم كيراس
EfficientDet D0 ٨ آدم دبليو بايتورتش
EfficientDet D1 ٨ آدم دبليو بايتورتش
الجدول 4 نتائج الدقة المتوسطة (AP) (المتوسط والانحراف المعياري) لتقنية التحقق المتقاطع بخمسة أضعاف التي تم تقييمها على مجموعة الاختبار التوافقية. تم تمييز أفضل المقاييس بالخط العريض.
نموذج تسوس المينا تسوس العاج آفة ثانوية معدل الدقة المتوسطة
YOLOv5 M
ريتنا نت
EfficientDet D0
EfficientDet D1
الدقة والاسترجاع للتطبيق الحالي، حيث يُفضل الكشف عن التسوس المحتمل. حقق نموذج YOLOv5 أعلى درجات AP لجميع الفئات، بالإضافة إلى أعلى درجات F1 لاثنتين من ثلاث فئات، وأدنى معدل للخطأ السلبي الكاذب لجميع الفئات.
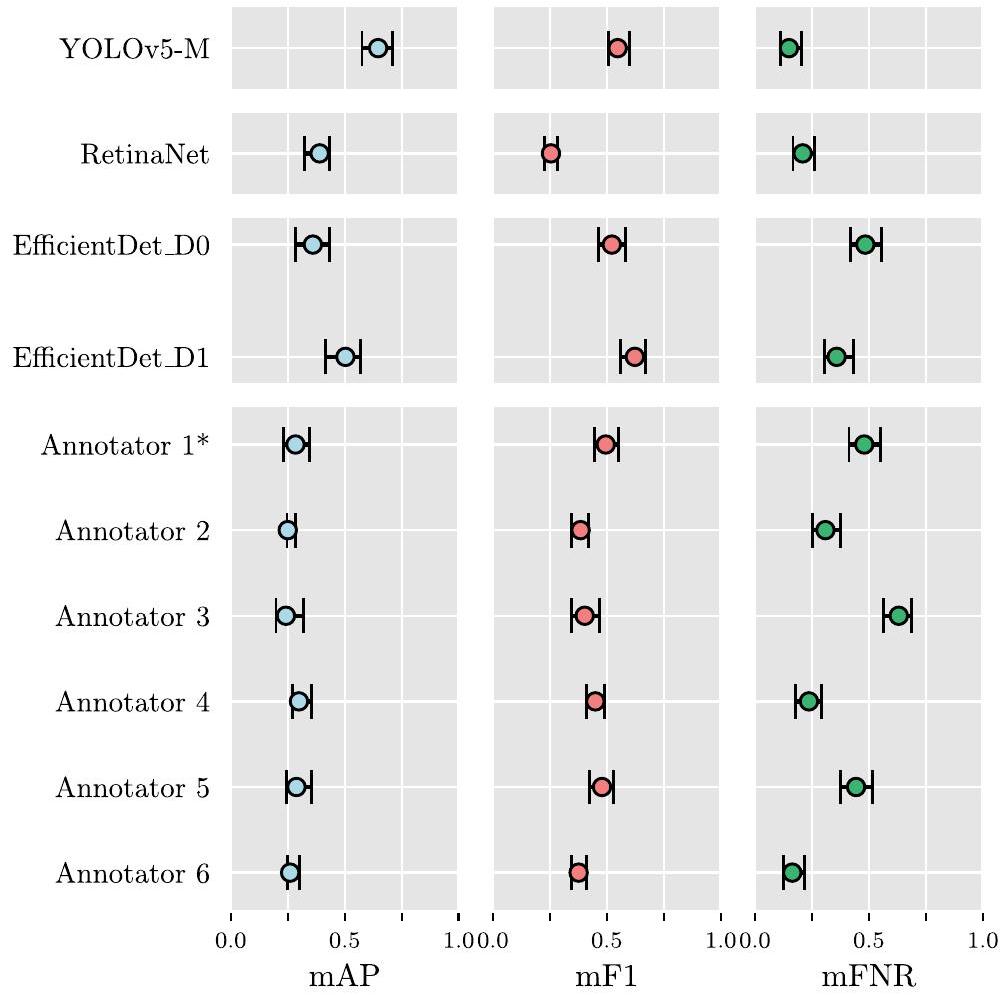
يمكن العثور على فترات الثقة لوسائل توزيعات مقاييس الأداء، المحسوبة لكل نموذج ولكل مُعَلق، في الجدول 7. كما هو موضح في قسم “تقييم الأداء”، تم استخدام هذه الفترات لتقييم الأهمية الإحصائية بين الهياكل المختلفة، وكذلك بين النماذج وأداء المُقيّم البشري. يتم عرض تمثيل بياني لهذه الفترات في الشكل 4، لتسهيل التفسير.
بشكل عام، كانت درجات جميع نماذج اكتشاف الكائنات مشابهة أو أفضل من تلك الخاصة بالم annotators الخبراء البشريين. من حيث AP، حقق نموذج YOLOv5 درجات أعلى بكثير من جميع الم annotators، بالإضافة إلى RetinaNet و EfficientDet D0. كما حققت نماذج RetinaNet و EfficientDet درجات mAP مشابهة أو أفضل بكثير من الم annotators. فيما يتعلق بـ F1، حقق نموذج YOLOv5 درجات أعلى بكثير من نموذج RetinaNet و 4 من 6 annotators، لكن الفرق مع نماذج EfficientDet لم يكن كبيرًا. حققت نماذج EfficientDet درجات mF1 مشابهة أو أفضل من الم annotators، بينما كانت درجة mF1 لنموذج RetinaNet أقل بكثير من معظم الم annotators.
الجدول 5 نتائج F1-score (المتوسط والانحراف المعياري) للتقييم بخمس طيات على مجموعة الاختبار التوافقية. تم تمييز أفضل المقاييس بالخط العريض.
نموذج تسوس المينا تسوس العاج آفة ثانوية mF1
YOLOv5 M
ريتنا نت
EfficientDet D0
EfficientDet D1
الجدول 6 نتائج معدل السلبية الكاذبة (FNR) (المتوسط والانحراف المعياري) للتقييم بخمس طيات على مجموعة الاختبار التوافقية. تم تمييز أفضل المقاييس بالخط العريض.
نموذج تسوس المينا تسوس العاج آفة ثانوية mFNR
YOLOv5 M
ريتنا نت
EfficientDet D0
EfficientDet D1
الجدول 7 متوسط دقة المتوسط (mAP) ومتوسط درجة F1 (mF1) ومتوسط معدل السلبية الكاذبة (mFNR) لتقييم النماذج (المدربة على الطية الخامسة) والمعلقين الفرديين على مجموعة اختبار الإجماع، مع عتبة loU تبلغ 0.3. جميع المقاييس مُبلغ عنها كدرجة على مجموعة الاختبار الكاملة، وفترة ثقة 95%. تم تمييز أفضل النتائج بين النماذج والمعلقين بخط عريض. *المعلقون الذين لم يكملوا مهمة التوصيف الفردي (انظر “بروتوكول التحقق”)
نموذج / مُعَلِّق معدل الدقة المتوسطة mF1 mFNR
YOLOv5، طوي 0.647 [0.566, 0.707] 0.548 [0.506، 0.598] 0.149 [0.110، 0.203]
ريتنا نت طوي 0.407 [0.355, 0.458] 0.177 [0.154، 0.202] 0.210 [0.167, 0.262]
EfficientDet D0، طوي 0.360 [0.290, 0.431] 0.522 [0.461، 0.588] 0.484 [0.422، 0.552]
EfficientDet D1، طوي 0.503 [0.421، 0.569] 0.503 [0.421، 0.569] 0.359 [0.306, 0.431]
المُعَلِّق 1* 0.284 [0.231, 0.347] 0.495 [0.447، 0.552] 0.480 [0.413, 0.552]
المُعَلِّق 2 0.250 [0.247، 0.285] 0.385 [0.346, 0.420] 0.309 [0.251، 0.374]
المُعَلِّق 3 0.242 [0.199, 0.320] 0.403 [0.343، 0.470] 0.631 [0.564, 0.686]
المُعَلِّق 4 0.299 [0.270, 0.353] 0.450 [0.411، 0.492] 0.237 [0.180, 0.292]
المُعَلِّق 5 0.288 [0.244, 0.356] 0.479 [0.423، 0.528] 0.444 [0.376، 0.515]
المُعَلِّق 6 0.261 [0.248، 0.301] 0.376 [0.346، 0.410] 0.164 [0.124، 0.217]
الشكل 4 بوتستراب فترات الثقة للمعايير و للنماذج والمعلقين
فيما يتعلق بمعدل الخطأ الإيجابي الكاذب (FNR)، كان نموذج YOLOv5 أفضل بشكل ملحوظ (درجات أقل) من 4 من المعلقين، وبالمثل، كان معدل الخطأ الإيجابي الكاذب المتوسط (mFNR) لنموذج RetinaNet أفضل بشكل ملحوظ من 3 من المعلقين. حققت نماذج EfficientDet درجات mFNR كانت مشابهة أو أعلى بشكل ملحوظ من المعلقين، مما يعني أن الأداء كان مشابهًا أو أسوأ من أداء المعلقين. يمكن العثور على النتائج لكل فئة في الجدول 2 في القسم 4 من المواد الإضافية 1.

نقاش

في الدراسة المقدمة، تم تدريب وتقييم ثلاثة هياكل مختلفة للكشف عن الأجسام باستخدام التعلم العميق على مهمة الكشف عن تسوس الأسنان القريب في صور الأشعة السينية BW. تم وضع علامات على التسوس من قبل أطباء الأسنان وتصنيفه إلى ثلاث مجموعات: المينا، والعاج، والآفات الثانوية. تم تقييم الأداء التنبؤي للنماذج من حيث مقاييس الكشف عن الأجسام AP، وF1-score، وFNR، ومقارنتها بأداء المعلقين الخبراء من البشر على مجموعة اختبار توافقية. كانت النتيجة الرئيسية هي أن جميع أداء النماذج كان متساويًا أو أفضل من المعلقين البشر، حيث حقق أفضل نموذج درجات أعلى بشكل ملحوظ من المعلقين البشر لجميع المقاييس.
تتضمن مجموعة البيانات المقدمة في هذه الدراسة 13,882 صورة بالأشعة السينية للأسنان، مع وجود تسوسات موضحة بواسطة ستة أطباء أسنان.
لأطباء الأسنان. إلى أفضل معرفتنا، هذه هي أكبر مجموعة بيانات تم تقديمها حتى الآن لمهمة تدريب نماذج كشف الكائنات لاكتشاف التسوس، متجاوزة حجم مجموعة البيانات الموصوفة في [11] بـ 3,000 صورة، وفي [14] بـ 3,686 صورة بالأبيض والأسود. تم تقديم استراتيجية جديدة لدمج التعليقات التوضيحية من عدة معلقين على نفس الصورة، مما أدى إلى إنشاء تعليقات توضيحية قوية للحقيقة الأساسية للتدريب من خلال دمج المعرفة المتخصصة لجميع المعلقين. بالإضافة إلى ذلك، تم التعليق على مجموعة اختبار تتكون من 197 صورة بشكل مشترك من قبل جميع المعلقين من خلال اتفاق بالإجماع. تم استخدام مجموعة اختبار الإجماع لمقارنة أداء النماذج مقابل أداء المعلقين الفرديين، مما يسمح بتقييم فائدة النماذج من خلال المقارنة مع قاعدة بيانات المعرفة البشرية المتخصصة.
كما هو موضح في قسم “بروتوكول التحقق”، تم تقييم أداء كل من المعماريات باستخدام التحقق المتقاطع بخمس طيات. تم بناء الطيات من خلال أخذ عينات عشوائية من الصور دون استبدال. قد تؤدي هذه الطريقة إلى تسرب البيانات حيث تم إجراء الانقسام على مستوى الصورة بدلاً من مستوى المريض. ومع ذلك، نظرًا لحجم مجموعة البيانات، والتعزيز أثناء معالجة الصور، وحقيقة أن تلك المسحات التي تتعلق بمريض واحد تظهر مناطق مختلفة من طقم الأسنان، فإن خطر التسرب يكون في الحد الأدنى. بالإضافة إلى ذلك، تم تقييم جميع النماذج.
على مجموعة اختبار الإجماع، المقدمة في الجداول 4 و 5 و 6. تم اعتبار المقاييس المختارة، AP، وF1-score، وFNR، مناسبة لهذه التجربة، حيث تلخص جودة النماذج في التعرف بشكل صحيح على التسوس (AP)، والتوازن بين الدقة والاسترجاع (F1-score)، ومعدل تجاهل كاشفات الأجسام للتسوس الموجود في صور BW (FNR). من خلال استخدام تنفيذ PASCAL VOC للمقاييس، يتم تقليل دقة AP باستخدام عدد أكبر من النقاط، مقارنة بالتداخل ذو الـ 11 نقطة لمنحنى AP، المستخدم في تنفيذ COCO لـ AP [28]. أدى ذلك إلى تقدير أفضل لهذه المقياس، وبالتالي اعتُبر مناسبًا لهذه الدراسة. أخيرًا، لتقييم الفرق الإحصائي في أداء
تم تقدير فترات الثقة باستخدام خوارزمية BCa [27] من قبل النماذج والمعلقين الخبراء.
حقق نموذج YOLOv5 أفضل أداء من حيث المقاييس المستخدمة في الدراسة. حقق كل من EfficientDet D1 و YOLOv5 أداءً أفضل بكثير من RetinaNet من حيث المقياس المتوسط للدقة (mAP) ودرجة F1 (mF1)، على الرغم من أن عدد المعلمات لهذه النماذج أقل من عدد معلمات RetinaNet. في الواقع، فإن EfficientDet D1 هو خُمس حجم RetinaNet، ومع ذلك فقد حقق أداءً أفضل من حيث المقياس المتوسط للدقة ودرجة F1. من ناحية أخرى، حقق كل من YOLOv5 و RetinaNet درجات FNR أقل بكثير من نماذج EfficientDet. باختصار، أظهرت جميع الهياكل المعروضة نقاط قوة وضعف مختلفة.
الشكل 5 تفاصيل صور الأجنحة العضلية من مجموعة اختبار الإجماع مع التوقعات المقدمة من النماذج المدربة. الحقيقة الأرضية موضحة في الصف السفلي
ويجب أن تؤخذ استراتيجية تجميع النماذج بعين الاعتبار، لتحسين قوة التنبؤات. توضح الشكل 5 مثالاً على التنبؤات المقدمة من كل بنية على ثلاث صور بالأبيض والأسود مختلفة، حيث يتم تقديم الحقيقة الأرضية كمرجع في الصف السفلي.
بالمقارنة مع الدراسات المنشورة سابقًا والتي تتشابه في النطاق مع العمل المقدم، فإن أداء النماذج أقل من القيم المبلغ عنها في [4، 5، 8-13، 15]، على الرغم من أن القيم ليست قابلة للمقارنة بشكل مباشر لأنها تم الإبلاغ عنها على مجموعات بيانات مختلفة. على عكس هذه الدراسات، لم يكن التركيز في هذا العمل على تحسين وبناء نموذج مخصص لاكتشاف الكائنات، بل على تقييم ما إذا كانت مجموعة البيانات كافية للحصول على أداء مكافئ أو أفضل من أطباء الأسنان، باستخدام هياكل متطورة. في الواقع، كما هو موضح في قسم “النتائج”، حققت النماذج المدربة أداءً أعلى بشكل ملحوظ في مجموع جميع المقاييس. وبالتالي، يمكن أن تكون مجموعة من نقاط القوة والضعف للنماذج أساسًا قويًا لأداة مساعدة في اكتشاف الآفات التسوسية في الممارسة السريرية.
كما تم تقديمه في قسم “المقدمة”، فإن الاستخدام الحصري لصور BW لتحديد الآفات التسوسية يعتبر غير كافٍ، حيث يتطلب فحصًا مباشرًا ومتابعة للمنطقة المصابة. ومع ذلك، فإن النماذج المقدمة في التعلم العميق لديها القدرة على تحسين كفاءة تحليل صور البايتوينغ والمساعدة في اكتشاف هذه الآفات، مما يساعد على تسريع وتحسين اكتشاف وتشخيص التسوس.
الهياكل المعمارية المدرجة في هذه الدراسة لم يتم تعديلها أو تخصيصها للبيانات المستخدمة أو التطبيقات، على عكس الأعمال المنشورة سابقًا [4-13، 15]. من المتوقع أن يؤدي ترتيب النماذج المدربة بطريقة تجميعية إلى زيادة الأداء العام، وموثوقية التنبؤات. أيضًا، يمكن أن يعزز الاستدلال على مستوى القطع الأداء من خلال تعريض الشبكة لرؤية أقرب للقطع السنية، بدلاً من العمل على الصورة الكاملة. يجب النظر في تقنيات تعزيز أخرى، مثل تعزيز غاما والسطوع. يمكن النظر في تقنيات الذكاء الاصطناعي القابلة للتفسير لفهم عملية اتخاذ القرار للنماذج المدربة بشكل أفضل، مثل الميزات المكتشفة لكل فئة. أخيرًا، يجب أن توفر الأعمال المستقبلية معلومات حول وقت الاستدلال، لتقييم ما إذا كانت نماذج الكشف مناسبة للاستخدام في الممارسة العملية.

الاستنتاجات

يتطلب الكشف عن تسوس الأسنان وتحديده في صور الأشعة السينية البصرية عدة صعوبات، بما في ذلك الرؤية الأحادية للهياكل السنية، وبالتالي، وجود تشوهات بسبب تداخل القطع السنية. لذلك، من الممارسات الشائعة إجراء فحص بصري لـ
تم العثور على آفات في الصور الطبية. في هذه الدراسة، تم إظهار كيف يمكن لمكتشفات الأجسام المدعومة بالذكاء الاصطناعي تسهيل مهمة العثور على هذه الآفات في الصور، مع أداء أفضل من أطباء الأسنان. لدعم هذا البيان، تم تدريب ثلاث هياكل متطورة لاكتشاف الأجسام على مجموعة بيانات صور دراسة صحة الفم HUNT4، وتم تقييمها مقابل أطباء الأسنان الخبراء. من بين الهياكل الثلاثة، حقق YOLOv5 (الحجم المتوسط) أفضل النتائج، حيث حصل على درجات أعلى بكثير من المعلقين الخبراء. يمكن استخدام مجموعة من النماذج المقدمة كأداة مساعدة في العيادة، لتسريع وتحسين معدل اكتشاف الآفات التسوسية. سيتم تقييم فائدة مثل هذه الأداة في دراسة تحقق سريرية مستقبلية.

الاختصارات

الذكاء الاصطناعي الذكاء الاصطناعي
تعلم الآلة تعلم الآلة
دي إل التعلم العميق
بي دبليو صورة بينية
OPG صورة أشعة بانورامية
سند دين التقاطع على الاتحاد
NSM خوارزمية قمع غير الحد الأقصى
MDF دالة كثافة المزيج
CLAHE تعديل تباين الهيستوغرام التكيفي المحدود
AP الدقة المتوسطة
فورمولا 1 درجة F1
FNR معدل السلبية الكاذبة
معدل الدقة المتوسطة متوسط الدقة عبر الفئات
mF1 متوسط درجة F1 عبر الفئات
mFNR معدل السلبية الكاذبة المتوسطة عبر الفئات

معلومات إضافية

تحتوي النسخة الإلكترونية على مواد إضافية متاحة علىhttps://doi. org/10.1186/s12903-024-04120-0.

المادة التكميلية 1.

شكر وتقدير

يود المؤلفون أن يعبروا عن امتنانهم لأطباء الأسنان الذين ساعدوا في توضيح صور BW: ترين ماثيسون باي، غونار لينغستاد، أود-أرن أوبلاند، هارالد سوليم، وماتس سال. كما نشكر ثيودور ريمان، الرئيس التنفيذي لشركة Boneprox A.S. ومدير مشروع AI-Dentify. علاوة على ذلك، نود أن نشكر هيدا هوفيك، أستريد ج. فويرهيرم، وباتريك سيتريلي الذين يعملون في TkMidt على مساعدتهم في معالجة البيانات، واللوجستيات، وتوفير الموارد.
دراسة صحة تروندلاغ (HUNT) هي تعاون بين مركز أبحاث HUNT (كلية الطب وعلوم الصحة، جامعة النرويج للعلوم والتكنولوجيا NTNU)، مجلس مقاطعة تروندلاغ، هيئة الصحة الإقليمية في وسط النرويج، والمعهد النرويجي للصحة العامة.

مساهمات المؤلفين

تصور: JPdF، RHH، SD، AS؛ المنهجية: JPdF، RHH، SD، AS؛ جمع البيانات: JPdF، LCN؛ التحليل الرسمي والتحقيق: JPdF، RHH، SD، LCN؛ كتابة – إعداد المسودة الأصلية: JPdF، RHH، SD؛ كتابة – المراجعة والتحرير: JPdF، RHH، SD، LCN، AS، TL؛ الحصول على التمويل: TL، TR، AS؛ الموارد: TL، TR، AS؛ الإشراف: TL، TR، AS.

تمويل

تم توفير تمويل الوصول المفتوح من قبل SINTEF. مشروع AI-Dentify (رقم المشروع 321408-IPNÆRINGSLIV20) ممول من قبل مجلس البحث النرويجي، في إطار مشروع الابتكار للقطاع الصناعي.

توفر البيانات والمواد

تمت الموافقة على مركز أبحاث HUNT من قبل هيئة البيانات النرويجية لتخزين وإدارة البيانات بشكل آمن. يتم مشاركة البيانات غير المحددة الهوية مع الباحثين بعد موافقة اللجنة الأخلاقية الإقليمية ومركز أبحاث HUNT على بروتوكول البحث الخاص بهم. لحماية خصوصية المشاركين، يقلل مركز أبحاث HUNT من تخزين البيانات خارج بنك البيانات الخاص به ويمتنع عن إيداع البيانات في المستودعات المفتوحة. يتم الاحتفاظ بسجلات مفصلة لجميع البيانات المصدرة لمشاريع مختلفة في بنك بيانات HUNT، ويمكن للمركز إعادة إنتاج هذه المعلومات عند الطلب. تصدير البيانات غير مقيد، بشرط تقديم طلبات معتمدة إلى مركز أبحاث HUNT. جميع البيانات في هذه المخطوطة متاحة من TkMidt (جهة الاتصال: أبهيدجيت سين، abhijit.sen@ntnu.no ) عند الطلب المعقول.
يمكن توفير الشيفرة والنماذج المدربة عند الطلب المعقول إلى Boneprox A.B. (الاتصال: شريا ديساي، shreya.desai@boneprox.se ).

إعلانات

تم منح الموافقة الأخلاقية بالفعل من قبل اللجنة الأخلاقية الإقليمية (REK) التي تتخذ من وسط النرويج مقراً لها (رقم المشروع 64645)، كما حصلت أيضاً على موافقة من Norsk Senter for Forskningsdata (رقم المرجع 718269). في دراسة صحة الفم HUNT4، تم الحصول على موافقة مكتوبة وموقعة من المشاركين [19].
غير قابل للتطبيق.

المصالح المتنافسة

يعلن المؤلفون عن المصالح المالية/العلاقات الشخصية التالية التي قد تعتبر مصالح متنافسة محتملة: SD موظف في Boneprox A.B.، وTR هو الرئيس التنفيذي لشركة Boneprox A.S.، وهو أحد مؤسسي Boneprox A.S.
تاريخ الاستلام: 30 سبتمبر 2023 تاريخ القبول: 7 مارس 2024
تم النشر على الإنترنت: 18 مارس 2024

References

  1. Organisation WH. Global oral health status report: towards universal health coverage for oral health by 2030. Geneva: World Health Organization; 2022.
  2. Schwendicke F, Tzschoppe M, Paris S. Accuracy of dental radiographs for caries detection. Evid-Based Dent. 2016;17(2):43. https://doi.org/10.1038/sj.ebd. 6401166.
  3. Schwendicke F, Göstemeyer G. Conventional bitewing radiography. Clin Dent Rev. 2020;4(1):22. https://doi.org/10.1007/s41894-020-00086-8.
  4. Devito KL, de Souza Barbosa F, Filho WNF. An artificial multilayer perceptron neural network for diagnosis of proximal dental caries. Oral Surg Oral Med Oral Pathol Oral Radiol Endod. 2008;106(6):879-84. https://doi.org/10. 1016/J.TRIPLEO.2008.03.002.
  5. Berdouses ED, Koutsouri GD, Tripoliti EE, Matsopoulos GK, Oulis CJ, Fotiadis DI. A computer-aided automated methodology for the detection and classification of occlusal caries from photographic color images. Comput Biol Med. 2015;62:119-35. https://doi.org/10.1016/J.COMPBIOMED.2015.04.016.
  6. Singh P, Sehgal P. Automated caries detection based on Radon transformation and DCT. 8th International Conference on Computing, Communications and Networking Technologies, ICCCNT 2017. 2017. https://doi.org/10. 1109/ICCCNT.2017.8204030.
  7. Hwang JJ, Jung YH, Cho BH, Heo MS. An overview of deep learning in the field of dentistry. Imaging Sci Dent. 2019;49(1):1. https://doi.org/10.5624/isd. 2019.49.1.1.
  8. Prados-Privado M, García Villalón J, Martínez-Martínez CH, Ivorra C, PradosFrutos JC. Dental Caries Diagnosis and Detection Using Neural Networks: A Systematic Review. J Clin Med. 2020;9(11):3579. https://doi.org/10.3390/ jcm9113579.
  9. Schwendicke F, Golla T, Dreher M, Krois J. Convolutional neural networks for dental image diagnostics: A scoping review. J Dent. 2019;91:103226. https:// doi.org/10.1016/j.jdent.2019.103226.
  10. Choi J, Eun H, Kim C. Boosting Proximal Dental Caries Detection via Combination of Variational Methods and Convolutional Neural Network. J Signal
Process Syst. 2018;90(1):87-97. https://doi.org/10.1007/S11265-016-1214-6/ FIGURES/10.
11. Srivastava MM, Kumar P, Pradhan L, Varadarajan S. Detection of Tooth caries in Bitewing Radiographs using Deep Learning. 2017. arXiv preprint arXiv: 1711.07312.
12. Lee JH, Kim DH, Jeong SN, Choi SH. Detection and diagnosis of dental caries using a deep learning-based convolutional neural network algorithm. J Dent. 2018;77:106-11. https://doi.org/10.1016/J.JDENT.2018.07.015.
13. Lee S, Oh Si, Jo J, Kang S, Shin Y, Park Jw. Deep learning for early dental caries detection in bitewing radiographs. Sci Rep. 2021;11(1):16807. https://doi. org/10.1038/s41598-021-96368-7.
14. Cantu AG, Gehrung S, Krois J, Chaurasia A, Rossi JG, Gaudin R, et al. Detecting caries lesions of different radiographic extension on bitewings using deep learning. J Dent. 2020;100:103425. https://doi.org/10.1016/j.jdent. 2020.103425.
15. Park EY, Cho H, Kang S, Jeong S, Kim EK. Caries detection with tooth surface segmentation on intraoral photographic images using deep learning. BMC Oral Health. 2022;22(1):573. https://doi.org/10.1186/s12903-022-02589-1.
16. Godfellow I, Bengio Y, Courville A. Deep Learning. MIT Press; 2016. http:// www.deeplearningbook.org/.
17. Krokstad S, Langhammer A, Hveem K, Holmen T, Midthjell K, Stene T, et al. Cohort Profile: The HUNT Study. Norway Int J Epidemiol. 2012;42(4):968-77. https://doi.org/10.1093/ije/dys095.
18. Stødle IH, Verket A, Høvik H, Sen A, Koldsland OC. Prevalence of periodontitis based on the 2017 classification in a Norwegian population: The HUNT study. J Clin Periodontol. 2021;48(9):1189-99. https://doi.org/10.1111/jcpe. 13507.
19. Rødseth SC, Høvik H, Schuller AA, Skudutyte-Rysstad R. Dental caries in a Norwegian adult population, the HUNT4 oral health study; prevalence, distribution and 45-year trends. Acta Odontol Scand. 2022;81(3):202-10. https://doi.org/10.1080/00016357.2022.2117735.
20. Smistad E, Østvik A, Lovstakken L. Annotation Web – An open-source webbased annotation tool for ultrasound images. 2021. p. 1-4. https://doi.org/ 10.1109/IUS52206.2021.9593336.
21. Westberg TE, Døving LM, Bjørg A. Kliniske rutiner- Kariologi. 2010. https:// www.odont.uio.no/iko/om/organisasjon/fagavd/kariologi-gerodontologi/ rutiner-metoder/. Accessed 12/07/2021.
22. Hansson HH, Espelid I. Kan vi stole på kariesregistreringen? Validering av to visuelle indekser for registrering av okklusalkaries basert på ekstraherte tenner. Nor Tannlegeforen Tid. 2012;(122):676-682. https://doi.org/10.56373/ 2012-9-11.
23. Lin TY, Goyal P, Girshick R, He K, Dollár P. Focal Loss for Dense Object Detection. 2017. arXiv preprint arXiv:1708.02002.
24. Jocher G, Chaurasia A, Stoken A, Borovec J, NanoCode012, Kwon Y, et al. ultralytics/yolov5: v7.0- YOLOv5 SOTA Realtime Instance Segmentation. 2022. https://doi.org/10.5281/ZENODO.7347926.
25. Tan M, Pang R, Le QV. EfficientDet: Scalable and efficient object detection. Proceedings of the IEEE Computer Society Conference on Computer Vision and Pattern Recognition. 2020. p. 10778-10787. https://doi.org/10.1109/ CVPR42600.2020.01079.
26. Georgieva VM, Mihaylova AD, Petrov PP. An application of dental X-ray image enhancement. 2017 13th International Conference on Advanced Technologies, Systems and Services in Telecommunications, TELSIKS. 2017. p. 447-450. https://doi.org/10.1109/TELSKS.2017.8246321.
27. Davison AC, Hinkley DV. Boostrap methods and their applications. New York: Cambridge University Press; 1997.
28. Padilla R, Passos WL, Dias TLB, Netto SL, Da Silva EAB. A comparative analysis of object detection metrics with a companion open-source toolkit. Electronics. 2021;10(3):279. https://doi.org/10.3390/ELECTRONICS10030279.

ملاحظة الناشر

تظل Springer Nature محايدة فيما يتعلق بالمطالبات القضائية في الخرائط المنشورة والانتماءات المؤسسية.

Journal: BMC Oral Health, Volume: 24, Issue: 1
DOI: https://doi.org/10.1186/s12903-024-04120-0
PMID: https://pubmed.ncbi.nlm.nih.gov/38494481
Publication Date: 2024-03-18

AI-Dentify: deep learning for proximal caries detection on bitewing x-ray – HUNT4 Oral Health Study

Javier Pérez de Frutos , Ragnhild Holden Helland , Shreya Desai , Line Cathrine Nymoen , Thomas Langø , Theodor Remman and Abhijit Sen

Abstract

Background Dental caries diagnosis requires the manual inspection of diagnostic bitewing images of the patient, followed by a visual inspection and probing of the identified dental pieces with potential lesions. Yet the use of artificial intelligence, and in particular deep-learning, has the potential to aid in the diagnosis by providing a quick and informative analysis of the bitewing images. Methods A dataset of 13,887 bitewings from the HUNT4 Oral Health Study were annotated individually by six different experts, and used to train three different object detection deep-learning architectures: RetinaNet (ResNet50), YOLOv5 (M size), and EfficientDet (D0 and D1 sizes). A consensus dataset of 197 images, annotated jointly by the same six dental clinicians, was used for evaluation. A five-fold cross validation scheme was used to evaluate the performance of the AI models.

Results The trained models show an increase in average precision and F1-score, and decrease of false negative rate, with respect to the dental clinicians. When compared against the dental clinicians, the YOLOv5 model shows the largest improvement, reporting 0.647 mean average precision, 0.548 mean F1-score, and 0.149 mean false negative rate. Whereas the best annotators on each of these metrics reported , and 0.164 respectively. Conclusion Deep-learning models have shown the potential to assist dental professionals in the diagnosis of caries. Yet, the task remains challenging due to the artifacts natural to the bitewing images.

Keywords Caries detection, Bitewing, Digital dentistry, Deep learning, Object detection
*Correspondence:
Javier Pérez de Frutos
javier.perezdefrutos@sintef.no
Department of Health Research, SINTEF Digital, Professor Brochs gate 2, Trondheim 7030, Norway
Boneprox A.B., Gothenburg, Sweden
Boneprox A.S., Tønsberg, Norway
Department of public Health and Nursing, Norwegian University of Science and Technology, Trondheim, Norway
Kompetansesenteret Tannhelse Midt (TkMidt), Trondheim, Norway

Introduction

As reported in the WHO Global Oral Health Status Report in 2022 [1], globally 3.5 billion people are afflicted by some form of oral disease, and 2 billion suffer from caries in permanent teeth. Furthermore, untreated dental caries in permanent teeth is the most common dental health condition. Diagnosis of such lesions requires both the inspection of clinical images e.g., X-ray (bi-dimensional images) or cone beam computed tomography (tridimensional images), as well as the visual examination and probing of the affected tooth or teeth. This procedure is time consuming, and requires a high level experience
when analysing the clinical images. The two main image modalities used to assist and support the examination of caries are bitewing (BW) and panoramic radiography (OPG) [2, 3]. Caries, particularly proximal caries, a type of carious lesion located on the surfaces between adjacent teeth, are difficult to detect manually or visually (i.e. using radiographic X-ray images) due to artifacts. Also, poor angulation can hinder the correct identification of the lesions or even occlude lesser grade caries.
Since 2008, the research on the application of artificial intelligence (AI) and, more specifically, deep learning (DL) convolutional neural networks (CNN) models for the analysis of dental has noticeably increased [4-13]. However, research on this field is still limited compared to other clinical areas. Data availability and reliable annotations [ 8,13 ] are the main bottlenecks in the development of machine learning (ML) methods in dentistry. A large portion of the published work uses a dataset of fewer than 300 images, only few studies have access to large datasets [8] with more than 1,000 images like [11, 14, 15]. Of these publications, the work presented in [4 focus on object detection, which is the scope of the present study. Object detection or object recognition refers to the task of localising and classifying objects in a picture [16]. The localisation is usually marked using axis-aligned bounding boxes, surrounding the outermost boundary of the item of interest.
In Devito et al. [4], a multi-layer perceptron with 51 artificial neurons ( 25 in the input layer, 25 in the hidden layer, and one in the output layer) is used to detect proximal caries on BW images, using a dataset of 160 images annotated by 25 experts. Whereas in Srivastava et al. [11], a caries detector built using a tailor designed fully connected neural network was trained with 3,000 annotated BW images. In Singh et al. [6], hand-crafted features for X-ray images are built using Radon and discrete cosine transformations, and further classified using an ensemble of ML techniques such as random forest. Park et al. [15] proposed an ensemble of U-Net and Fast R-CNN for caries detection in colour image, trained with 2,348 RGB intraoral photographic images. Even though, the work done by Cantu et al. [14] focuses on image segmentation, it is worth mentioning because of the dataset used: 3,686 BW images, with caries segmentation annotations, to train a U-Net model for segmentation.

Study goals

In this study we compare three state-of-the-art deep learning architectures for object detection on the task of proximal caries detection, namely RetinaNet, YOLOv5, and EfficientDet. By using an extensive and annotated dataset, we hypothesised that AI object detection models can perform in equal or better terms than dental
clinicians. Hence, in this study we trained the aforementioned architectures in detection and classification of enamel caries, dentine caries, and secondary lesions, in BW images. Then, the models were compared to human annotators in order to test our hypothesis. In addition, a novel processing pipeline for merging multi-observer object detection annotations, based on Gaussian Mixture Models, is proposed.

Methods

Dataset

The bitewing images used in this study were collected as part of the HUNT4 Oral Health Study on the prevalence of periodontitis in a Norwegian population, a sub-study of the fourth phase of the HUNT study [17]. The HUNT4 Oral Health Study is a collaborative study between several Norwegian institutes including: the HUNT research centre, the Kompetansesenteret Tannhelse Midt (TkMidt), the Norwegian University of Technology (NTNU), the University of Oslo (UiO), the Tannhelsetjenestens Kompetansesenter Øst (TkØ), and the Norwegian National Centre for Ageing and Health.
The data collected consisted of clinical and radiographic oral examination, which took place between 2017 and 2019. A total of 7,347 participants were invited to participate in the study, out of a population of 137,233 people (2017) [18]. Only 4,933 participants where included in the Oral Health survey study, out of which, 4,913 completed both clinical and radiographic examination [18, 19]. A total of 19,210 BW and 4,871 OPG images where collected from the participants. The demographics of the dataset showed a distribution of female and 2,174 ( ) male participants, with ages ranging from 19 to 94 years ( years on average) [18]. For this study, only the BW images were considered.
The following subsections will further describe the steps of the workflow followed in the present study, which is depicted in Fig. 1.

Data annotation

The data was annotated by six dental clinicians with extensive experience in the diagnosis of proximal caries, using the open-source annotation tool AnnotationWeb [20]. The caries were classified in five different categories shown in Table 1. Further details of the annotation procedure can be found in Section 1 of the Additional Materials 1.
To clean the annotations so as to get a ground truth to train the AI models, a novel object detection multiobservers annotations combination strategy was envisioned for this project. First, the annotated bounding boxes were grouped based on the intersection over union (IoU) score, a metric which describes how well the
Fig. 1 Data workflow. The HUNT4 Oral Health Study bitewings were stored on a dedicated server, and made available to the expert dentists and dental hygienists for annotation, resulting in the annotated data and the consensus test set. The resulting annotations were merged to build the datasets used in this study. The training dataset was further split following a K-fold (in this study K = 5) cross-validation (CV), and pre-processed. The AI models were trained and evaluated on both the CV test set and the consensus test set
Table 1 Definition of the classes used to annotate the dataset
Label name Description
Grade 1 Radiolucent in outer half of the enamel [21, 22]
Grade 2 Radiolucent in the inner half of the enamel, but not in the dentine [21,22]
Grade 3 Radiolucent in the outer third of the dentine [21,22]
Grade 4 Radiolucent in 2/3 of the dentine [21,22]
Grade 5 Radiolucent in the inner third of the dentine [21, 22]
Secondary lesion Caries related to sealants or restorations
Unknown grade Caries whose grade cannot be clearly identified
boxes overlap. Then, a Gaussian distribution was fitted to each bounding box in the group, along the vertical and horizontal axes. A mixture density function (MDF) of a Gaussian Mixture Model in which all distributions have the same weight, was obtained by combining the probability density functions of the fitted Gaussian distributions.The common bounding box was then obtained from the MDF given a probability threshold ( ), as detailed in Algorithm 2, in the Additional Materials 1. Alternatively, the non-maximum suppression (NMS) algorithm can be used to find the best fitting bounding box. However, since all the annotations had the same level of confidence, unlike the predictions done by an AI model, NMS will be biased towards the first bounding box selected as
a reference. Lastly, the label of the common bonding box was determined based on the most voted class among the bounding boxes in the group. In case of tie, the most severe class was chosen e.g., dentine caries over enamel caries.
A total of 13,887 images were annotated by one to six of the dental clinicians (see Fig. 2), having a total of 13,585 images annotated by more than one dental clinician.
The distribution of labels in Fig. 3 shows a higher volume of secondary lesions than all the other grades. After discussion with the dental clinicians, it was agreed to merge the grade one and two under the label of “enamel caries”, and grades three to five under the group of “dentine caries”. Secondary caries and unknown grade groups were kept as separate label groups.
In addition, 197 images were annotated by consensus agreement among all the expert annotators, so as to build a test set for evaluation purposes. To create this dataset, hereafter consensus test set, all annotators (dental clinicians) were brought together in the same room and agreement was achieved by consensus on the annotation of the images. The images in the consensus test set had previously been annotated by all annotators individually, with a considerable time gap between the individual annotations and the creation of the consensus agreement annotations, so that the annotations could be considered independent of each other.
Fig. 2 Distribution of annotated images in the annotated dataset. In the legend, the number of annotated images for each interval is shown within brackets
Fig. 3 Distribution of annotations in the dataset annotated by the six dental clinicians. Enamel proximal caries (Grades 1 and 2, total 19,995 annotations) are pictured in light green, dentine lesions (Grade 3 to 5 , total 17,903 annotations) are in orange, secondary lesions are depicted in pink, and caries of uncertain grade have been highlighted in white. Image free of lesions (No caries) are shown in dark blue, here the number of annotations matches the number of images

Object detection models

Three state of the art object detection architectures were evaluated for caries detection: RetinaNet (Keras implementation) [23] (ResNet50 backbone), YOLOv5 [24] (size M), and EfficientDet [25] (pretrained D0 and D1). All the models used transfer learning, which is a common strategy when adapting object detection models to a particular dataset, by loading the weights of models trained on a larger dataset set e.g., ImageNet or COCO datasets. RetinaNet was initialised with the weights of ResNet50 trained on ImageNet dataset, YOLOv5 loaded the weights pretrained on COCO dataset (provided in the original repository https://github.com/ultralytics/yolov5), and EfficientDet pretrained weights were obtained from https://github.com/rwightman/efficientdet-pytorch. For better comparison of the architectures, Table 2 shows the number of parameters for each architecture. Due to time restrictions, not all the versions of YOLOv5 and EfficientDet are included in the current results. The preprocessing and post-processing were kept the same for all models and experiments. Preliminary experiments were conducted with the contrast limited adaptive histogram
Table 2 Number of parameters of each architecture
Architecture Number of parameters (millions)
YOLOv5 M 21.2 M
RetinaNet (ResNet50) 36.4 M
EfficientDet D0 3.9 M
EfficientDet D1 M 6.6M
equalization (CLAHE) method, inspired by Georgieva et al. [26], but these experiments were eliminated before the final round of cross-validation because they did not lead to any improvement in the scores. Only intensity standardisation to the range , and horizontal and vertical flipping were used to augment the training dataset, both being applied with a probability of 0.5 .
The training was done on a dedicated server running Ubuntu 20.04. The machine featured a NVidia Quadro RTX 5000 GPU with 16 GB VRAM, a Intel Core i7-9700 CPU, 32 GB RAM, 1 TB SSD, and 8 TB HDD. The training
parameters for each model are summarised in Table 3. In the case of YOLOv5 and RetinaNet, the learning rate was monitored using a learning rate scheduler. For YOLOv5, the OneCycleLR scheduler from PyTorch was used with a maximum learning rate of . Whereas for RetinaNet, a step learning rate scheduler was used with the patience set to 10 epochs. For both RetinaNet and EfficientDet, an early stopper was used to prevent overfitting. A patience of 20 and minimum loss increment of was configure for RetinaNet, and a patience of 50 and minimum increment of for EfficientDet.

Validation protocol

After removing the images rejected by the annotators (980), images with unknown grade annotations , and those in the consensus test dataset (197), the remaining 8,342 images were split into five folds to perform a cross-validation (CV) study. Random sampling without replacement was used to build the folds. The cross-validation training and evaluation was performed with a three-way-split, i.e. for each iteration, three folds were used for training, one fold was used for validation during training, to avoid overfitting; and the final fold was kept aside as a test set for the final performance evaluation.
To test our hypothesis on the performance of AI models, both the trained models in each fold and the annotators were evaluated against the consensus test set. However, due to time constraints, one of the annotators did not complete the individual annotation task, missing one image, and thus the resulting metrics of this annotators are not strictly comparable to those of the models
and other annotators. This annotator is marked with an asterisk (*) in Table 7.

Performance evaluation

As aforementioned, the models described in “Object detection models” section and the annotators were evaluated on the consensus test set. The metrics used in the evaluation were the standard metrics for evaluating object detection model performance: average precision (AP) for each of the classes, the mean average precision (mAP) across classes, the F1-score (F1) for each of the classes, the mean F1-score (mF1), as a surrogate for the recall and precision, the false negative rate (FNR) for each class, and the average across classes (mFNR). These three metrics are in the range .
Bootstrap confidence intervals (95%) were computed for the test results of both the models and the annotators, to compare the performance of these. For this comparison, the models trained on the fold were used. The intervals were computed using the bias-corrected and accelerated bootstrap algorithm [27], with 1,000 iterations for confidence interval. Significance in score differences between annotators and models were determined based on overlap of the confidence intervals.

Results

The evaluation results on the consensus test set for the five-fold cross-validation can be found in Tables 4, 5 and 6 (the results per fold can be found in Table 1 in Section 4 of the Additional Material 1). The metrics were computed using the PASCAL VOC metrics implemented in [28], with an IoU thresholds of 0.3 . The threshold was deemed an adequate trade-off between
Table 3 Training parameters for each model
Architecture Batch size Learning rate Max. epochs Optimiser Framework
YOLOv5 M 8 180 SGD PyTorch
RetinaNet 4 200 Adam Keras
EfficientDet D0 8 AdamW PyTorch
EfficientDet D1 8 AdamW PyTorch
Table 4 Average precision (AP) results (mean and standard deviation) of the five-fold cross-validation evaluated on the consensus test set. The best metrics are highlighted in bold
Model Enamel caries Dentine caries Secondary lesion mAP
YOLOv5 M
RetinaNet
EfficientDet D0
EfficientDet D1
precision and recall for the current application, where detection of potential caries is preferred. The YOLOv5 model reached the highest AP scores for all classes, as well as the highest F1-scores for two out of three classes, and the lowest FNR for all classes.
The confidence intervals for the means of the distributions of the performance metrics, calculated for each model and each annotator, can be found in Table 7. As described in “Performance evaluation” section, these intervals were used to assess statistical significance between the different architectures, as well as between the models and the human expert rater performance. A graphical representation of these is show in Fig. 4, for ease of interpretation.
Overall, the scores of all of the object detection models were similar to or better than that of the human expert annotators. In terms of AP, the YOLOv5 model achieved significantly higher scores than all of the annotators, as well as the RetinaNet and the EfficientDet D0. The RetinaNet and EfficientDet models also achieved mAP-scores that were similar to or significantly better than the annotators. Regarding F1, The YOLOv5 model achieved significantly higher scores than the RetinaNet model and 4 out of 6 annotators, but the difference with the EfficientDet models were not significant. The EfficientDet models achieved mF 1 -scores similar to or better than the annotators, whereas the mF 1 -score of the RetinaNet model was significantly lower than most of the annotators. In
Table 5 F1-score results (mean and standard deviation) of the five-fold cross-validation evaluated on the consensus test set. The best metrics are highlighted in bold
Model Enamel caries Dentine caries Secondary lesion mF1
YOLOv5 M
RetinaNet
EfficientDet D0
EfficientDet D1
Table 6 False negative rate (FNR) results (mean and standard deviation) of the five-fold cross-validation evaluated on the consensus test set. The best metrics are highlighted in bold
Model Enamel caries Dentine caries Secondary lesion mFNR
YOLOv5 M
RetinaNet
EfficientDet D0
EfficientDet D1
Table 7 Mean average precision (mAP), mean F1-score (mF1), and mean false negative rate (mFNR) evaluation of the models (trained on the fifth fold) and individual annotators on the consensus test set, with an loU-threshold of 0.3. All metrics are reported as score over the whole test set, and a 95% confidence interval. The best results among the models and the annotators have been highlighted in bold letter. *annotators who did not complete the individual annotation task (see “Validation protocol”)
Model / Annotator mAP mF1 mFNR
YOLOv5, fold 0.647 [0.566, 0.707] 0.548 [0.506, 0.598] 0.149 [0.110, 0.203]
RetinaNet, fold 0.407 [0.355, 0.458] 0.177 [0.154, 0.202] 0.210 [0.167, 0.262]
EfficientDet D0, fold 0.360 [0.290, 0.431] 0.522 [0.461, 0.588] 0.484 [0.422, 0.552]
EfficientDet D1, fold 0.503 [0.421, 0.569] 0.503 [0.421, 0.569] 0.359 [0.306, 0.431]
Annotator 1* 0.284 [0.231, 0.347] 0.495 [0.447, 0.552] 0.480 [0.413, 0.552]
Annotator 2 0.250 [0.247, 0.285] 0.385 [0.346, 0.420] 0.309 [0.251, 0.374]
Annotator 3 0.242 [0.199, 0.320] 0.403 [0.343, 0.470] 0.631 [0.564, 0.686]
Annotator 4 0.299 [0.270, 0.353] 0.450 [0.411, 0.492] 0.237 [0.180, 0.292]
Annotator 5 0.288 [0.244, 0.356] 0.479 [0.423, 0.528] 0.444 [0.376, 0.515]
Annotator 6 0.261 [0.248, 0.301] 0.376 [0.346, 0.410] 0.164 [0.124, 0.217]
Fig. 4 Bootstrap confidence intervals for the metrics and , for the models and the annotators
terms of FNR, the YOLOv5 model was significantly better (lower scores) than 4 annotators, and similarly, the mFNR of the RetinaNet was significantly better than 3 of the annotators. The EfficientDet models achieved mFNR scores that were similar to or significantly higher than the annotators, meaning that the performance was similar to worse than that of the annotators. The results per class can be found in Table 2 in Section 4 of the Additional Materials 1.

Discussion

In the presented study, three different object detection DL architectures were trained and evaluated on the task of detection of proximal caries in BW X-ray images. The caries were annotated by dental clinicians and classified into three groups: enamel, dentine, and secondary lesions. The predictive performance of the models was assessed in terms of the object detection metrics AP, F1-score, and FNR, and compared against the performance of human expert annotators on a consensus test set. The main finding is that all model performances were on par with or better than the human annotators, with the best model achieving significantly higher scores than the human annotators for all metrics.
The dataset presented in this study features 13,882 BW images, with carious lesions annotated by six dental
clinicians. To the best of our knowledge, this is the largest dataset presented so far for the task of training object detection models for caries detection, exceeding the size of the dataset described in [11] with 3,000 images, and in [14] with 3,686 BW images. A novel strategy for combining the annotations from multiple annotators on the same image was presented, creating robust ground truth annotations for training by combining the expert knowledge of all the annotators. In addition, a test set consisting of 197 images was jointly annotated by all the annotators by consensus agreement. The consensus test set was used to compare the model performances against the performance of the individual annotators, allowing for an assessment of the models usefulness by comparison against a baseline of human expert knowledge.
As detailed in “Validation protocol” section, the performance of each of the architectures was assessed using five-fold cross validation. The folds were built through random sampling of the images without replacement. This approach could lead to data leakage as the split was performed at image level instead of patient level. Nonetheless, due to the size of the dataset, the augmentation during the pre-processing of the images, and the fact that those scans corresponding to a single patient show different regions of the denture, the risk of leakage is minimised. In addition, all of the models were evaluated
on the consensus test set, presented in Tables 4, 5 and 6. The selected metrics, AP, F1-score, and FNR, were deemed appropriate for this experiment, as they summarise the goodness of the models to correctly identify the caries (AP), the trade off between precision and recall (F1-score), and the rate at which the object detectors disregard the caries which are in the BW images (FNR). By using the PASCAL VOC implementation of the metrics, the AP precision is regressed using a larger amount of points, compared to the 11-point interpolation of the AP curve, used in the COCO implementation of AP [28]. This resulted in a better estimate of this metric, and was therefore considered adequate for this study. Lastly, to assess the statistical difference in performance of the
models and the expert annotators, confidence intervals were estimated using the BCa algorithm [27].
The YOLOv5 model achieved the best performance in terms of the metrics used in the study. Both the EfficientDet D1 and YOLOv5 achieved significantly better performance than the RetinaNet in terms of mAP and mF 1 -score, even though the number of parameters for these models are lower than that of the of RetinaNet. Indeed, EfficientDet D1 is one fifth the size of RetinaNet, and yet it performed better in terms of mAP and F1. On the other hand, both the YOLOv5 and the RetinaNet achieved significantly lower FNR-scores than the EfficientDet models. In sum, all of the presented architectures exhibited different strengths and weaknesses,
Fig. 5 Detail of bitewing images from the consensus test set with predictions given by the trained models. The ground truth is shown in the bottom row
and an ensemble strategy of the models should be thus be considered, to improve the robustness of the predictions. Figure 5 shows an example of the predictions given by each architecture on three different BW images, the ground truth is given for reference at the bottom row.
Compared to equivalent previously published studies, comparable in scope with the presented work, the performances of the models are lower than the values reported in [4, 5, 8-13, 15], although the values are not directly comparable as they are reported on different datasets. Unlike in these studies, the focus of this work was not to optimise and build a tailored object detection model, but to assess if the dataset was sufficient to obtain equivalent or better performance than dental clinicians, using state-of-the-art architectures. Indeed, as shown in “Results” section, the trained models achieved significantly higher performances in sum on all of the metrics. A combination of the models strengths and weaknesses could thus be a solid foundation for an assistive tool for carious lesion detection in clinical practice.
As introduced in “Introduction” section, the exclusive use of BW images to identify carious lesions is under-par, as it requires a follow-up direct inspection and probing of the infected area. However, the presented deep learning models have the potential to improve the efficiency of the analysis of the bitewing images and aid in the detection of these lesions, helping to speed up and improve the detection and diagnosis of caries.
The architectures included in this study were not modified nor tailored for the used dataset or applications, unlike previously published works [4-13, 15]. Arranging the trained models in an ensemble fashion is expected to increase the overall performance, and the robustness of the predictions. Also, a patch-wise inference could further boost the performance by exposing the network to a closer view of the dental pieces, instead of working on the whole picture. Other augmentation techniques should be considered, such as gamma and brightness augmentations. Explainable AI techniques could be considered to better comprehend the decision process of the trained models, e.g., the features detected for each class. Finally, future work should provide information regarding the inference runtime, so as to assess if it the detection models are suitable to be used in practice.

Conclusions

Detection and identification of caries on BW images entails several difficulties, including the monocular view of the dental structures, and hence, presence of artifacts due to the overlap of the dental pieces. Therefore, it is common practice to perform a visual inspection of the
lesions found in the medical images. In this study, it has been shown how AI-powered object detectors can ease the task of finding these lesions in the images, with better performance than dental clinicians. To support this statement, three state-of-the-art object detection architectures were trained on the HUNT4 Oral Health Study BW image dataset, and evaluated against expert dental clinicians. Out of the three architectures, YOLOv5 (medium size) yielded the best results, achieving significantly higher scores than the expert annotators. A combination of the presented models can be used as an assistive tool in the clinic, to speed up and improve the detection rate of carious lesions. The usefulness of such a tool will be assessed in a future clinical validation study.

Abbreviations

AI Artificial intelligence
ML Machine learning
DL Deep learning
BW Bitewing image
OPG Panoramic X-ray image
IoU Intersection over union
NSM Non-maximum suppression algorithm
MDF Mixture density function
CLAHE Contrast limited adaptive histogram equalization
AP Average precision
F1 F1-score
FNR False negative rate
mAP Mean average precision across classes
mF1 Mean F1-score across classes
mFNR Mean false negative rate across classes

Supplementary Information

The online version contains supplementary material available at https://doi. org/10.1186/s12903-024-04120-0.

Supplementary Material 1.

Acknowledgements

The authors would like to express their gratitude to the dental clinicians that helped with the annotations of the BW images: Trine Matheson Bye, Gunnar Lyngstad, Odd-Arne Opland, Harald Solem, and Mats Säll. Also to Theodor Remman, CEO of Boneprox A.S., and project manager of the AI-Dentify project. Furthermore, we would like to thank Hedda Høvik, Astrid J. Feuerherm, and Patrik Cetrelli working at TkMidt for helping in data processing, logistics, and making resources available.
The Trøndelag Health Study (HUNT) is a collaboration between HUNT Research Centre (Faculty of Medicine and Health Sciences, Norwegian University of Science and Technology NTNU), Trøndelag County Council, Central Norway Regional Health Authority, and the Norwegian Institute of Public Health.

Authors’ contributions

Conceptualization: JPdF, RHH, SD, AS; Methodology: JPdF, RHH, SD, AS; Data acquisition: JPdF, LCN; Formal analysis and investigation: JPdF, RHH, SD, LCN; Writing – original draft preparation: JPdF, RHH, SD; Writing – review and editing: JPdF, RHH, SD, LCN, AS, TL; Funding acquisition: TL, TR, AS; Resources: TL, TR, AS; Supervision: TL, TR, AS.

Funding

Open access funding provided by SINTEF The AI-Dentify project (project number 321408-IPNÆRINGSLIV20) is funded by the Research Council of Norway, under the scope of the Innovation Project for the Industrial Sector.

Availability of data and materials

The HUNT Research Centre is authorised by the Norwegian Data Inspectorate to securely store and manage the data. De-identified data are shared with researchers upon approval of their research protocol by the Regional Ethical Committee and HUNT Research Centre. To safeguard participant privacy, HUNT Research Centre minimises data storage outside its data bank and refrains from depositing data in open repositories. Detailed records of all exported data for various projects are maintained in the HUNT data bank, and the centre can reproduce this information upon request. Data export is unrestricted, subject to approved applications submitted to HUNT Research Centre. All the data in the this manuscript are available from TkMidt (contact: Abhijit Sen, abhijit.sen@ntnu.no ) on reasonable request.
The code and trained models can be provided upon reasonable request to Boneprox A.B. (contact: Shreya Desai, shreya.desai@boneprox.se ).

Declarations

Ethical approval has already been granted by the Regional Ethical Committee (REK) based in central Norway (project number 64645), and also had approval from Norsk Senter for Forskningsdata (reference number 718269). In the HUNT4 Oral Health Study, written and signed consent was acquired from the participants [19].
Not applicable.

Competing interests

The authors declare the following financial interest/personal relationships that may be considered as potential competing interests: SD is employee at Boneprox A.B., and TR is CEO of Boneprox A.S., and is co-founder of Boneprox A.S.
Received: 30 September 2023 Accepted: 7 March 2024
Published online: 18 March 2024

References

  1. Organisation WH. Global oral health status report: towards universal health coverage for oral health by 2030. Geneva: World Health Organization; 2022.
  2. Schwendicke F, Tzschoppe M, Paris S. Accuracy of dental radiographs for caries detection. Evid-Based Dent. 2016;17(2):43. https://doi.org/10.1038/sj.ebd. 6401166.
  3. Schwendicke F, Göstemeyer G. Conventional bitewing radiography. Clin Dent Rev. 2020;4(1):22. https://doi.org/10.1007/s41894-020-00086-8.
  4. Devito KL, de Souza Barbosa F, Filho WNF. An artificial multilayer perceptron neural network for diagnosis of proximal dental caries. Oral Surg Oral Med Oral Pathol Oral Radiol Endod. 2008;106(6):879-84. https://doi.org/10. 1016/J.TRIPLEO.2008.03.002.
  5. Berdouses ED, Koutsouri GD, Tripoliti EE, Matsopoulos GK, Oulis CJ, Fotiadis DI. A computer-aided automated methodology for the detection and classification of occlusal caries from photographic color images. Comput Biol Med. 2015;62:119-35. https://doi.org/10.1016/J.COMPBIOMED.2015.04.016.
  6. Singh P, Sehgal P. Automated caries detection based on Radon transformation and DCT. 8th International Conference on Computing, Communications and Networking Technologies, ICCCNT 2017. 2017. https://doi.org/10. 1109/ICCCNT.2017.8204030.
  7. Hwang JJ, Jung YH, Cho BH, Heo MS. An overview of deep learning in the field of dentistry. Imaging Sci Dent. 2019;49(1):1. https://doi.org/10.5624/isd. 2019.49.1.1.
  8. Prados-Privado M, García Villalón J, Martínez-Martínez CH, Ivorra C, PradosFrutos JC. Dental Caries Diagnosis and Detection Using Neural Networks: A Systematic Review. J Clin Med. 2020;9(11):3579. https://doi.org/10.3390/ jcm9113579.
  9. Schwendicke F, Golla T, Dreher M, Krois J. Convolutional neural networks for dental image diagnostics: A scoping review. J Dent. 2019;91:103226. https:// doi.org/10.1016/j.jdent.2019.103226.
  10. Choi J, Eun H, Kim C. Boosting Proximal Dental Caries Detection via Combination of Variational Methods and Convolutional Neural Network. J Signal
Process Syst. 2018;90(1):87-97. https://doi.org/10.1007/S11265-016-1214-6/ FIGURES/10.
11. Srivastava MM, Kumar P, Pradhan L, Varadarajan S. Detection of Tooth caries in Bitewing Radiographs using Deep Learning. 2017. arXiv preprint arXiv: 1711.07312.
12. Lee JH, Kim DH, Jeong SN, Choi SH. Detection and diagnosis of dental caries using a deep learning-based convolutional neural network algorithm. J Dent. 2018;77:106-11. https://doi.org/10.1016/J.JDENT.2018.07.015.
13. Lee S, Oh Si, Jo J, Kang S, Shin Y, Park Jw. Deep learning for early dental caries detection in bitewing radiographs. Sci Rep. 2021;11(1):16807. https://doi. org/10.1038/s41598-021-96368-7.
14. Cantu AG, Gehrung S, Krois J, Chaurasia A, Rossi JG, Gaudin R, et al. Detecting caries lesions of different radiographic extension on bitewings using deep learning. J Dent. 2020;100:103425. https://doi.org/10.1016/j.jdent. 2020.103425.
15. Park EY, Cho H, Kang S, Jeong S, Kim EK. Caries detection with tooth surface segmentation on intraoral photographic images using deep learning. BMC Oral Health. 2022;22(1):573. https://doi.org/10.1186/s12903-022-02589-1.
16. Godfellow I, Bengio Y, Courville A. Deep Learning. MIT Press; 2016. http:// www.deeplearningbook.org/.
17. Krokstad S, Langhammer A, Hveem K, Holmen T, Midthjell K, Stene T, et al. Cohort Profile: The HUNT Study. Norway Int J Epidemiol. 2012;42(4):968-77. https://doi.org/10.1093/ije/dys095.
18. Stødle IH, Verket A, Høvik H, Sen A, Koldsland OC. Prevalence of periodontitis based on the 2017 classification in a Norwegian population: The HUNT study. J Clin Periodontol. 2021;48(9):1189-99. https://doi.org/10.1111/jcpe. 13507.
19. Rødseth SC, Høvik H, Schuller AA, Skudutyte-Rysstad R. Dental caries in a Norwegian adult population, the HUNT4 oral health study; prevalence, distribution and 45-year trends. Acta Odontol Scand. 2022;81(3):202-10. https://doi.org/10.1080/00016357.2022.2117735.
20. Smistad E, Østvik A, Lovstakken L. Annotation Web – An open-source webbased annotation tool for ultrasound images. 2021. p. 1-4. https://doi.org/ 10.1109/IUS52206.2021.9593336.
21. Westberg TE, Døving LM, Bjørg A. Kliniske rutiner- Kariologi. 2010. https:// www.odont.uio.no/iko/om/organisasjon/fagavd/kariologi-gerodontologi/ rutiner-metoder/. Accessed 12/07/2021.
22. Hansson HH, Espelid I. Kan vi stole på kariesregistreringen? Validering av to visuelle indekser for registrering av okklusalkaries basert på ekstraherte tenner. Nor Tannlegeforen Tid. 2012;(122):676-682. https://doi.org/10.56373/ 2012-9-11.
23. Lin TY, Goyal P, Girshick R, He K, Dollár P. Focal Loss for Dense Object Detection. 2017. arXiv preprint arXiv:1708.02002.
24. Jocher G, Chaurasia A, Stoken A, Borovec J, NanoCode012, Kwon Y, et al. ultralytics/yolov5: v7.0- YOLOv5 SOTA Realtime Instance Segmentation. 2022. https://doi.org/10.5281/ZENODO.7347926.
25. Tan M, Pang R, Le QV. EfficientDet: Scalable and efficient object detection. Proceedings of the IEEE Computer Society Conference on Computer Vision and Pattern Recognition. 2020. p. 10778-10787. https://doi.org/10.1109/ CVPR42600.2020.01079.
26. Georgieva VM, Mihaylova AD, Petrov PP. An application of dental X-ray image enhancement. 2017 13th International Conference on Advanced Technologies, Systems and Services in Telecommunications, TELSIKS. 2017. p. 447-450. https://doi.org/10.1109/TELSKS.2017.8246321.
27. Davison AC, Hinkley DV. Boostrap methods and their applications. New York: Cambridge University Press; 1997.
28. Padilla R, Passos WL, Dias TLB, Netto SL, Da Silva EAB. A comparative analysis of object detection metrics with a companion open-source toolkit. Electronics. 2021;10(3):279. https://doi.org/10.3390/ELECTRONICS10030279.

Publisher’s Note

Springer Nature remains neutral with regard to jurisdictional claims in published maps and institutional affiliations.