DOI: https://doi.org/10.1186/s12916-025-03957-8
PMID: https://pubmed.ncbi.nlm.nih.gov/40038753
تاريخ النشر: 2025-03-05
تعديل العوامل المربكة في الدراسات الرصدية التي تحقق في عوامل الخطر المتعددة: دراسة منهجية
الملخص
الخلفية: يعد تعديل العوامل المربكة أمرًا حاسمًا لاستنتاجات سببية دقيقة في الدراسات الرصدية. ومع ذلك، غالبًا ما يتم تجاهل ملاءمة الأساليب لتعديل العوامل المربكة في الدراسات التي تحقق في عوامل خطر متعددة، حيث لا تكون العوامل مرتبطة ببعضها البعض ببساطة. تهدف هذه الدراسة إلى تلخيص الأساليب المستخدمة لتعديل العوامل المربكة والقضايا ذات الصلة في الدراسات التي تحقق في عوامل خطر متعددة. الأساليب: تم إجراء دراسة منهجية. بحثنا في PubMed من يناير 2018 إلى مارس 2023 لتحديد الدراسات القائمة على المجموعات ودراسات الحالة والشاهد التي تحقق في عوامل خطر متعددة لثلاثة أمراض مزمنة (أمراض القلب والأوعية الدموية، السكري والخرف). تم اختيار الدراسات واستخراج البيانات بشكل مستقل من قبل مراجعَين. تم تصنيف أهداف الدراسة إلى فئتين: استكشاف عوامل الخطر المحتملة بشكل واسع وفحص عوامل الخطر المحددة. تم تصنيف الأساليب المستخدمة لتعديل العوامل المربكة بناءً على تلخيص الدراسات المشمولة، مع تحديد ست فئات: (1) تم تعديل كل عامل خطر لعوامل مربكة محتملة بشكل منفصل (الطريقة الموصى بها)؛ (2) تم تعديل جميع عوامل الخطر بشكل متبادل (أي تضمين جميع العوامل في نموذج متعدد المتغيرات)؛ (3) تم تعديل جميع عوامل الخطر لنفس العوامل المربكة بشكل منفصل؛ (4) تم تعديل جميع عوامل الخطر لنفس العوامل المربكة مع تعديل بعض العوامل بشكل متبادل؛ (5) تم تعديل جميع عوامل الخطر لنفس العوامل المربكة مع عدم وضوح التعديل المتبادل بينها؛ و (6) غير قادر على الحكم. تم تحليل جميع البيانات بشكل وصفي. النتائج: تم تضمين ما مجموعه 162 دراسة، حيث استكشفت 88 (54.3%) عوامل خطر محتملة و 74 (45.7%) فحصت عوامل خطر محددة. كانت الحالة الحالية لتعديل العوامل المربكة غير مرضية: حيث استخدمت عشر دراسات فقط (6.2%) الطريقة الموصى بها، والتي كانت تهدف جميعها إلى فحص عدة عوامل خطر محددة؛ في المقابل، تم اعتماد التعديل المتبادل في أكثر من 70% من الدراسات. أما الدراسات المتبقية فقد قامت إما بتعديل نفس العوامل المربكة عبر جميع عوامل الخطر، أو لم تكن قادرة على الحكم.
الكلمات الرئيسية: تعديل العوامل المربكة، الدراسات الرصدية، عوامل الخطر المتعددة، دراسة منهجية
الخلفية
لذا، فإن مجموعة العوامل المربكة محددة لكل علاقة عامل خطر-نتيجة.
في الدراسات الرصدية، تُستخدم نماذج الانحدار المتعدد المتغيرات بشكل شائع لتقدير تأثيرات التعرض-النتيجة، أو “الارتباطات المستقلة”، من خلال تضمين العامل المعني والعوامل المربكة المحتملة في النموذج. تشمل الدراسات التي تحقق في عوامل خطر متعددة علاقات متعددة بين عوامل الخطر والنتيجة مع عوامل مربكة مختلفة؛ لذلك، وفقًا لمبادئ تحديد العوامل المربكة وتعديلها [3]، من المناسب تعديل العوامل المربكة المحددة لكل علاقة بشكل منفصل، مما يتطلب نماذج انحدار متعددة المتغيرات. ومع ذلك، غالبًا ما تغفل الدراسات السابقة التي تحقق في عوامل خطر متعددة الدور المحدد لكل عامل خطر في الارتباطات بين عوامل الخطر الأخرى والنتيجة. على سبيل المثال، تضمنت دراسات كبيرة جميع عوامل الخطر المدروسة في نموذج متعدد المتغيرات.
الجنس → CVD: لا شيء
العمر → CVD: لا شيء
تاريخ العائلة → CVD: لا شيء
التدخين → CVD: الجنس، العمر، تاريخ العائلة، شرب الكحول
شرب الكحول → CVD: الجنس، العمر، تاريخ العائلة، التدخين
ارتفاع ضغط الدم → CVD: الجنس، العمر، تاريخ العائلة، التدخين، شرب الكحول
ملاحظات: العامل المربك هو سبب مشترك لكل من التعرض والنتيجة، وليس وسيطًا ناتجًا عن التعرض والذي بدوره يسبب النتيجة. بالإضافة إلى ذلك، لم نقدم عوامل مربكة محتملة أخرى (مثل الجينات، والسلوكيات الإضافية، والصحة النفسية) في الرسم.
النموذج [4-7]. تعني هذه الطريقة أن جميع عوامل الخطر تم تعديلها بشكل متبادل، مما قد يؤدي إلى معاملات لبعض العوامل تقيس “التأثير الكلي” بينما تقيس عوامل أخرى “التأثير المباشر”، مما قد يؤدي إلى تقديرات تأثير مضللة (أي “مغالطة الجدول 2”) [8]. ممارسة شائعة أخرى هي تعديل نفس العوامل المربكة بشكل منفصل لجميع عوامل الخطر المدروسة، مما قد يكون غير مناسب أيضًا [9-12]. بالمقابل، كان تعديل العوامل المربكة المحتملة لكل عامل خطر بشكل منفصل نادرًا ما يُرى في الدراسات المنشورة [13، 14].
قد يؤدي تعديل العوامل المربكة غير المناسب إلى تقدير أقل أو أعلى أو حتى عكس حجم التأثير. أوضحنا ذلك من خلال مقارنة تقديرات التأثير بين طريقتين لتعديل العوامل المربكة: تعديل العوامل المربكة المحتملة بشكل منفصل لكل عامل خطر والتعديل المتبادل لجميع عوامل الخطر. أجرينا هذه المقارنة باستخدام البيانات من دراستنا المنشورة سابقًا التي استكشفت العوامل المحتملة المرتبطة بتناول الأدوية في مرضى الرعاش الأساسي [15]. كما هو موضح في الملف الإضافي 1: الجدول S1، تقدم طريقتا التعديل اختلافات في تقديرات التأثير لبعض المتغيرات (مثل الجنس، التعليم، الرعشة النية). بالإضافة إلى ذلك، أوضح غرين وبوفام أيضًا أن التعديل المتبادل لمؤشرات اجتماعية واقتصادية متعددة (التعليم، المهنة والدخل) قد يؤدي إلى “مغالطة التعديل المتبادل”، مما يجعل المعاملات المعدلة بشكل متبادل لكل مؤشر غير قابلة للمقارنة [16]. بينما نعترف بأن هذه النتائج قد تكون متحيزة بسبب التصميم العرضي وعدد الدراسات المحدود، فإنها تسلط الضوء على الأهمية الحاسمة لتعديل العوامل المربكة بشكل مناسب لضمان تقديرات تأثير دقيقة في الدراسات التي تحقق في عوامل خطر متعددة.
الأساليب
معايير الأهلية
قمنا بتضمين جميع الدراسات التي استوفت المعايير التالية: (1) كان تصميم الدراسة دراسة جماعية أو دراسة حالة وشاهد؛ (2) كان هدف الدراسة هو التحقيق في عوامل الخطر/الحماية المتعددة (ثلاثة عوامل على الأقل)، والتي تم تصنيفها إلى عوامل خطر محتملة واسعة الاستكشاف (توليد الفرضيات) وفحص ارتباطات عدة عوامل خطر محددة مع نتيجة (مدفوعة بالفرضيات) [24]؛ (3) كان المشاركون بالغين (العمر
استراتيجية البحث واختيار الدراسة
استخراج البيانات
قواعد التصنيف حول طرق تعديل العوامل المربكة
مقدمة في الجدول 2. نظرًا لأن الدراسات التي تحقق في عوامل الخطر المتعددة تتضمن علاقات متعددة بين العوامل والنتائج، يجب تعديل العوامل المربكة بشكل منفصل لكل علاقة بناءً على مبادئ تعديل العوامل المربكة؛ لذلك، الفئة
تحليل البيانات
النتائج
وصف الدراسات
تظهر الخصائص الأساسية للدراسات المدرجة في الجدول 3. من بين 162 دراسة،
أ. تم تعديل كل عامل خطر بشكل منفصل لعوامل الارتباك المحتملة [موصى به]
مثال 2 (65): “بالنسبة للعمر عند تشخيص السرطان، تم تعديل النموذج ليتناسب مع مؤشر كتلة الجسم، ومؤشر الحالة الصحية، والعرق/الاثنية، واستخدام التبغ الأساسي، والتعليم، والأنسجة. بالنسبة لمؤشر كتلة الجسم الأساسي، ومؤشر الحالة الصحية، تم تعديل النماذج لتناسب مع العرق/الاثنية، واستخدام التبغ الأساسي، والتعليم، والإقامة في المناطق الريفية، والعمر عند التشخيص، وتاريخ العائلة من أمراض القلب والأوعية الدموية. بالنسبة للتعليم، تم تعديل النموذج ليتناسب مع العرق/الاثنية، والإقامة في المناطق الريفية. بالنسبة لاستخدام التبغ الأساسي، تم تعديل النموذج ليتناسب مع العرق/الاثنية، والتعليم، والإقامة في المناطق الريفية.”
ب. تم تعديل جميع عوامل الخطر بشكل منفصل لنفس العوامل المربكة
مثال 1 (14): “تم استخدام الانحدار اللوجستي لحساب نسبة الأرجحية المعدلة حسب العمر.”
مثال 2 (116): “قمنا بتقدير التأثيرات الرئيسية للتعليم، وصحة القلب والأوعية الدموية، ونمط جين APOE على خطر الخرف في العينة الكاملة في نماذج منفصلة مع تعديل لعمر الأساس، والعرق، والجنس.
مثال 3 (126): “الارتباط المعدل حسب التركيبة السكانية (المعدل حسب العرق، الجنس، الدخل، والتعليم).”
ب-ب. تم تعديل جميع عوامل الخطر بشكل منفصل لنفس العوامل المربكة المحتملة.
مثال 1 (145): “تم تضمين كل من العوامل المذكورة أعلاه في نموذج انحدار متعدد المتغيرات منفصل، مع التعديل حسب الجنس، ارتفاع ضغط الدم، داء السكري…”
مثال 2 (155): “تم تركيب أربعة نماذج لكل من خصائص الولادة: (1) بدون أي متغيرات مصاحبة؛ (2) مصحح للجنس، سنة الولادة، عدد الولادات، وعمر الأم؛ (3) مصحح لمستوى SES عند الولادة بالإضافة إلى المتغيرات المصاحبة المدرجة في النموذج 2؛ و(4) مصحح لمستوى التعليم بالإضافة إلى جميع المتغيرات المصاحبة المدرجة في النموذج 3.”
ج. تم تعديل جميع عوامل الخطر بشكل متبادل (أي تضمين جميع العوامل في نموذج متعدد المتغيرات)
تم استخدام تحليل الانحدار النسبي لمخاطر كوكز متعدد المتغيرات لحساب نسب المخاطر مع التعديل المتبادل لعوامل الخطر المدرجة.
مثال 2 (104): “عوامل مع
المثال 3 (151): “النموذج المعدل شمل جميع عوامل الخطر.”
ج-ب. بالنسبة للدراسات التي فحصت عدة عوامل خطر محددة، تم تعديل جميع عوامل الخطر بشكل متبادل بناءً على التعديل لعوامل الارتباك الأساسية. المثال 1 (17): “قمنا بتضمين جميع عوامل الخطر بالإضافة إلى العمر.”
مثال 2 (20): “تم تعديل عوامل الخطر بشكل متبادل، وقمنا أيضًا بتعديل العمر والجنس والعرق.”
مثال 3 (118): “أي متغير مع
تم تعديل جميع عوامل الخطر بشكل متبادل بناءً على تعديل العوامل المربكة المحتملة. المثال 1 (117): “تم تعديل النماذج حسب العمر، الجنس، العرق والإثنية، التعليم، وجود تأمين صحي، وجميع عوامل الخطر المدرجة في هذا التحليل.”
مثال 2 (127): “تم تعديل كل عامل من عوامل نمط الحياة حسب العمر والجنس والتعليم ومؤشر كتلة الجسم وتاريخ ارتفاع ضغط الدم وارتفاع الكوليسترول والسكري، وتم تعديلها بشكل متبادل مع العوامل الأخرى لنمط الحياة ومدة النوم.”
مثال 3 (148): “تم تضمين العوامل التي كانت قيمتها p <0.05 في التحليل الأحادي المتغير في تحليل الانحدار اللوجستي المتعدد المتغيرات.”
د. بالنسبة للدراسات التي فحصت عدة عوامل خطر محددة، تم تعديل جميع عوامل الخطر لنفس العوامل المربكة، مع عدم وضوح التعديل المتبادل بينها.
تم تعديل النموذج وفقًا للجنس والعمر وضغط الدم الانقباضي والانبساطي، والكوليسترول الكلي و HDL، والسكري، والتدخين، واستخدام الأدوية المخفضة للدهون، والأدوية المضادة لارتفاع ضغط الدم، والأدوية المحددة للروماتيزم.
تم تعديل جميع عوامل الخطر لنفس المتغيرات، مع تعديل بعض عوامل الخطر بشكل متبادل.
ف. غير قادر على الحكم
ملاحظات: في التصنيف أعلاه لطرق تعديل العوامل المربكة، معاني المصطلحات المحددة هي كما يلي: عوامل الخطر، عوامل الخطر المدروسة؛ العوامل المربكة، المتغيرات التي تم التعديل لها في نموذج الانحدار المتعدد المتغيرات، وبالتالي قد تكون العوامل المربكة أيضًا هي عوامل الخطر المدروسة، أو متغيرات أخرى بخلاف هذه العوامل.
مؤشر كتلة الجسم BMI، مؤشر تشارلسون للاعتلال المشترك CCI، مرض القلب والأوعية الدموية CVD، نسبة الأرجحية OR، البروتين الدهني عالي الكثافة HDL، إنزيم الألانين أمينوترانسفيراز ALT
عوامل الخطر، تلك التي درست عدة عوامل خطر محددة كانت أكثر احتمالاً أن تحتوي على أحجام عينات كبيرة، وأن تُنشر في مجلات الربع الأول، وأن تشمل مؤلفين من
طرق اختيار المتغيرات المربكة
العوامل. من الجدير بالذكر أنه في جميع الدراسات المشمولة، استخدمت دراستان فقط رسمًا بيانيًا سببيًا لاختيار المتغيرات المربكة.
طرق تعديل العوامل المربكة
من بين الدراسات التي استكشفت عوامل الخطر المحتملة على نطاق واسع، كانت الغالبية (
| خصائص | عوامل الخطر المحتملة التي تم استكشافها على نطاق واسع
|
تم فحص عدة عوامل خطر محددة
|
| تصميم الدراسة | ||
| دراسة جماعية | 66 (75.0) | ٥٧ (٧٧.٠) |
| دراسة الحالة والشاهد | ٢٢ (٢٥.٠) | 17 (23.0) |
| حجم العينة | ||
| <200 | 9 (10.2) | 2 (2.7) |
| ٢٠٠~ | 15 (17.1) | 5 (6.8) |
|
|
17 (19.3) | 4 (5.4) |
| 1000~ | 30 (34.1) | ٢٧ (٣٦.٥) |
| 10,000~ | 17 (19.3) | ٣٦ (٤٨.٧) |
| الرباعيات لعامل تأثير المجلة في سنة النشر | ||
| الربع الأول | ٣٤ (٣٨.٦) | ٤٧ (٦٣.٥) |
| أفضل 5% | ٤ (٤.٥) | 12 (16.2) |
| الربع الثاني | ٢٨ (٣١.٨) | 22 (29.7) |
| الربع الثالث والربع الرابع | ٢٦ (٢٩.٥) | 5 (6.8) |
| منطقة المؤلف الأول | ||
| أوروبا | 19 (21.6) | 23 (31.1) |
| أمريكا الشمالية | 18 (20.5) | 19 (25.7) |
| آسيا | ٣٦ (٤٠.٩) | ٢٨ (٣٧.٨) |
| الآخرون | 15 (17.1) | 4 (5.4) |
| درجة المؤلف الأول | ||
| درجة الدكتوراه | ٢٩ (٣٣.٠) | ٣٣ (٤٤.٦) |
| درجة الماجستير أو البكالوريوس | 8 (9.1) | 3 (4.1) |
| لا توجد معلومات | 51 (58.0) | ٣٨ (٥١.٤) |
| نوع الانتماء للمؤلف المراسل الأخير | ||
| جامعة | 51 (58.0) | ٤٨ (٦٤.٩) |
| مستشفى | 11 (12.5) | 2 (2.7) |
| معهد بحثي | 2 (2.3) | 1 (1.4) |
| كلا من الجامعة والمعهد الآخر | ٢٣ (٢٦.١) | 20 (27.0) |
| الآخرون | 1 (1.1) | 3 (4.1) |
| بما في ذلك المؤلفين من علم الأوبئة أو الإحصاء الحيوي | ||
| نعم | 16 (18.2) | ٣٩ (٥٢.٧) |
| لا | 51 (58.0) | 23 (31.1) |
| غير معروف | 21 (23.9) | 12 (16.2) |
| هل هناك علاقة أحادية الاتجاه بين أي من عوامل الخطر المدروسة؟ | ||
| نعم | ٨٨ (١٠٠) | 51 (68.9) |
| ربما نعم | 0 (0) | 14 (18.9) |
| لا أو غير متأكد | 0 (0) | 9 (12.2) |
| النتيجة المختارة | ||
| أمراض القلب والأوعية الدموية | 57 (64.8) | 40 (54.1) |
| السكري | ٢٦ (٢٩.٦) | 11 (14.9) |
| الخرف | 5 (5.7) | 23 (31.1) |
المتغيرات المربكة (الفئة
| طرق اختيار المتغيرات المربكة | دراسات استكشفت على نطاق واسع عوامل الخطر المحتملة
|
دراسات فحصت عدة عوامل خطر محددة
|
إجمالي |
| المعرفة السابقة فقط | ٢٤ (٢٧.٣) | 60 (81.1) | 84 (51.9) |
| استخدام الرسوم البيانية السببية | 1 (1.1) | 1 (1.4) | 2 (1.2) |
| نهج يعتمد فقط على البيانات | ٢٨ (٣١.٨) | 2 (2.7) | 30 (18.5) |
| تحليلات أحادية المتغير فقط | 15 (17.0) | 1 (1.4) | 16 (9.9) |
| خطوة بخطوة فقط | 9 (10.2) | 0 (0) | 9 (5.6) |
| كلا من التحليل الأحادي المتغير والتحليل التدريجي | 3 (3.4) | 1 (1.4) | ٤ (٢.٥) |
| أخرى (مثل: تغيير في التقدير) | 1 (1.1) | 0 (0) | 1 (0.6) |
| كلا من المعرفة السابقة والنهج المعتمد على البيانات | 20 (22.7) | 10 (13.5) | 30 (18.5) |
| استخدام الرسوم البيانية السببية | 0 (0) | 0 (0) | 0 (0) |
| معلومات غير كافية للحكم | 16 (18.2) | 2 (2.7) | 18 (11.1) |
| طرق تعديل العوامل المربكة | دراسات استكشفت على نطاق واسع عوامل الخطر المحتملة
|
دراسات فحصت عدة عوامل خطر محددة
|
| أ. تم تعديل كل عامل خطر بشكل منفصل لعوامل الارتباك المحتملة | 0 (0) | 10 (13.5) |
| ب. تم تعديل جميع عوامل الخطر بشكل منفصل لنفس العوامل المربكة | ||
| ب-أ. تم تعديل جميع عوامل الخطر بشكل منفصل لنفس العوامل المربكة الأساسية. | 2 (2.3) | 5 (6.8) |
| ب-ب. تم تعديل جميع عوامل الخطر بشكل منفصل لنفس العوامل المربكة المحتملة. | 0 (0) | 3 (4.1) |
| ج. تم تعديل جميع عوامل الخطر بشكل متبادل | ||
| ج-أ. بالنسبة للدراسات التي استكشفت على نطاق واسع عوامل الخطر المحتملة، تم تعديل جميع عوامل الخطر بشكل متبادل. | 77 (87.5) | غير متوفر |
| ج-ب. بالنسبة للدراسات التي فحصت عدة عوامل خطر محددة، تم تعديل جميع عوامل الخطر بشكل متبادل بناءً على التعديل لعوامل الارتباك الأساسية. | غير متوفر | 22 (29.7) |
| ج-ج. بالنسبة للدراسات التي فحصت عدة عوامل خطر محددة، تم تعديل جميع عوامل الخطر بشكل متبادل بناءً على التعديل لعوامل الارتباك المحتملة. | غير متوفر | 21 (28.4)
|
| د. بالنسبة للدراسات التي فحصت عدة عوامل خطر محددة، تم تعديل جميع عوامل الخطر لنفس العوامل المربكة، مع عدم وضوح التعديل المتبادل. | غير متوفر |
|
| هـ. تم تعديل جميع عوامل الخطر لنفس المتغيرات، مع تعديل بعض عوامل الخطر بشكل متبادل | 1 (1.1) | 1 (1.4) |
| ف. غير قادر على الحكم | 8 (9.1) | 0 (0) |
العوامل التي لم يتم تعديلها بشكل متبادل (الفئة ب-أ، 6.8%; الفئة
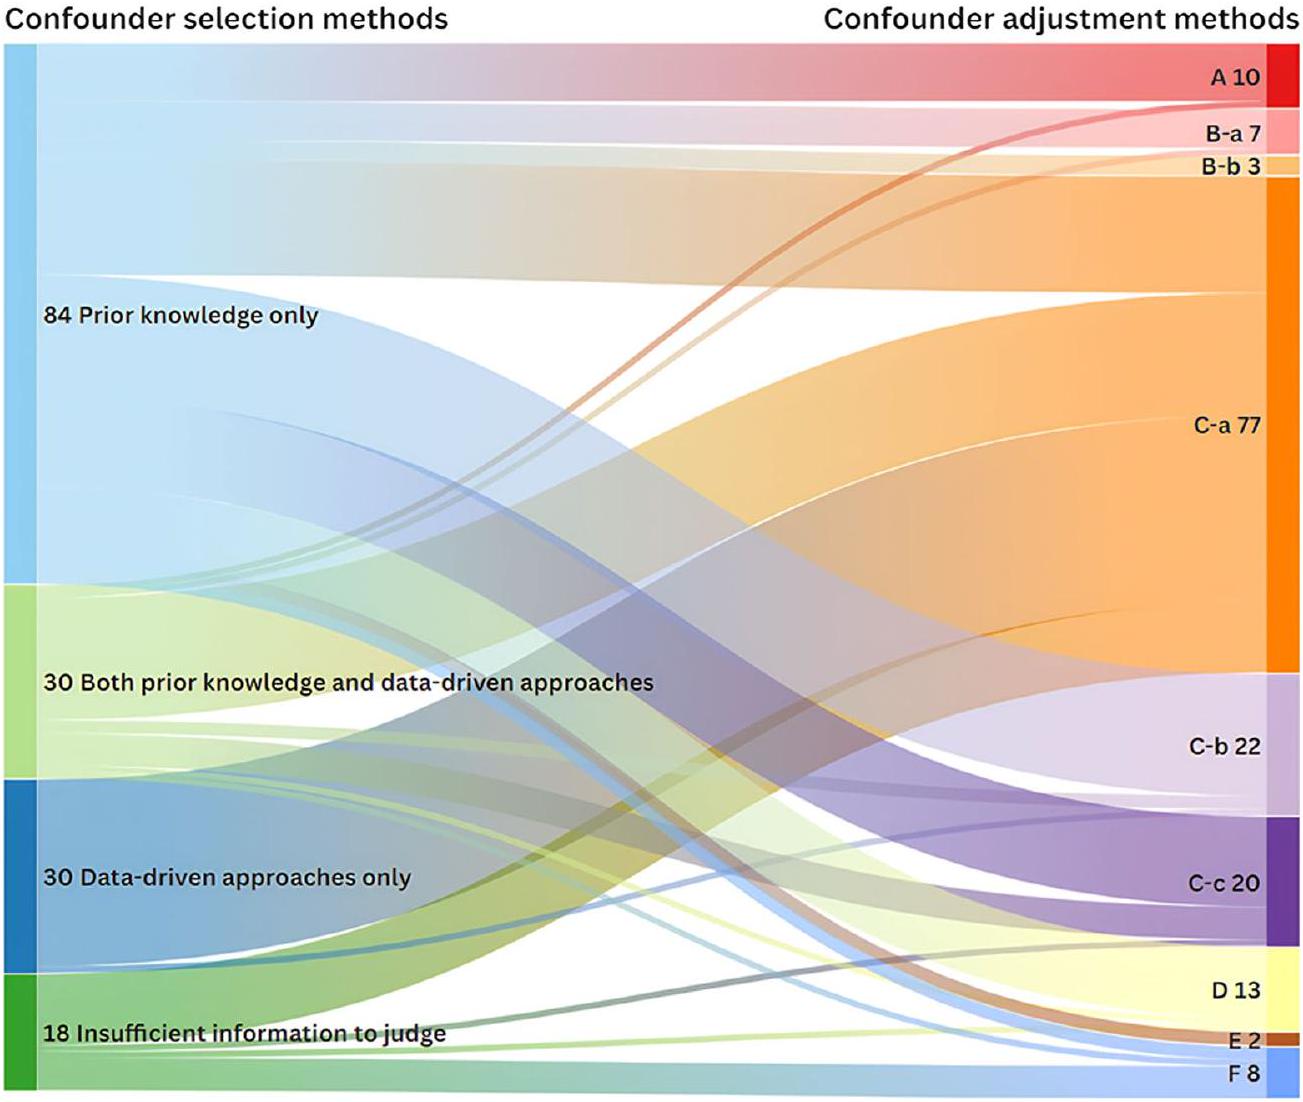
توضح الشكل 3 العلاقة بين الطرق لاختيار وتعديل المتغيرات المربكة. جميع الدراسات التي قامت بتعديل المتغيرات المربكة لكل عامل خطر على حدة (فئة
طرق اختيار المتغيرات التي تعتمد فقط على الأساليب المعتمدة على البيانات تؤدي مباشرة إلى التعديل المتبادل.
يوضح الجدول 6 خصائص المقارنات بين الطريقة الموصى بها وفئات أخرى. بشكل عام، كانت الدراسات التي استخدمت الطريقة الموصى بها لضبط المتغيرات المربكة أكثر احتمالاً أن تحتوي على حجم عينة كبير.
الملف الإضافي 1: الجداول S4 و S5 توضح طرق تعديل العوامل المربكة في الدراسات المنشورة في أعلى 5% من المجلات والمجلات الطبية ذات التأثير العالي و
نقاش
عامل الخطر؛ ومن الجدير بالذكر أن جميع هذه الدراسات كانت تهدف إلى فحص عدة عوامل خطر محددة. كانت الفئة الأكثر شيوعًا هي التعديل المتبادل لجميع عوامل الخطر. فيما يتعلق بالطرق المستخدمة لاختيار العوامل المربكة، اعتمدت الدراسات التي تفحص عدة عوامل خطر محددة على المعرفة السابقة بشكل أكثر تكرارًا وعلى الأساليب المعتمدة على البيانات بشكل أقل تكرارًا، مقارنة بالدراسات التي استكشفت عوامل الخطر المحتملة بشكل واسع.
الملاحظات والملاحظات
| خصائص | الدراسات التي اعتمدت الطريقة الموصى بها أو لم تعتمدها | |
| تم تبنيه
|
لم يتم تبنيه
|
|
| تصميم الدراسة | ||
| دراسة جماعية | 10 (100) | 114 (75.0) |
| دراسة الحالة والشاهد | 0 (0) | ٣٨ (٢٥.٠) |
| حجم العينة | ||
| <200 | 0 (0) | 11 (7.2) |
| ٢٠٠~ | 0 (0) | 20 (13.1) |
|
|
0 (0) | 21 (13.8) |
| 1000~ | 2 (20.0) | 55 (36.2) |
| 10,000~ | 8 (80.0) | ٤٥ (٢٩.٦) |
| الرباعيات لعامل تأثير المجلة | ||
| الربع الأول | 9 (90.0) | 72 (47.4) |
| أفضل 5% | 2 (20.0) | 14 (9.2) |
| الربع الثاني | 1 (10.0) | 49 (32.2) |
| الربع الثالث والربع الرابع | 0 (0) | 31 (20.4) |
| منطقة المؤلف الأول | ||
| أوروبا | 5 (50.0) | ٣٧ (٢٤.٣) |
| أمريكا الشمالية | 2 (20.0) | ٣٥ (٢٣.٠) |
| آسيا | 2 (20.0) | 62 (40.8) |
| آخرون | 1 (10.0) | 18 (11.8) |
| درجة المؤلف الأول | ||
| درجة الدكتوراه | ٤ (٤٠.٠) | 58 (38.2) |
| درجة الماجستير أو البكالوريوس | 1 (40.0) | 10 (6.6) |
| لا توجد معلومات | 5 (40.0) | 84 (55.3) |
| نوع الانتماء للمؤلف المراسل | ||
| جامعة | 8 (80.0) | 86 (56.6) |
| مستشفى | 1 (10.0) | 17 (11.2) |
| معهد بحث | 0 (0) | 3 (2.0) |
| كلا من الجامعة والمعهد الآخر | 1 (10.0) | 42 (27.6) |
| آخرون | 0 (0) | 4 (2.6) |
| بما في ذلك المؤلفين من علم الأوبئة أو الإحصاء الحيوي | ||
| نعم | 7 (70.0) | ٤٨ (٣١.٦) |
| لا | 2 (20.0) | 72 (47.4) |
| غير معروف | 1 (10.0) | 32 (21.1) |
قد تؤدي التعديلات المفرطة إلى إخفاء التأثير الحقيقي للفائدة، بينما لا تؤثر التعديلات غير الضرورية على التأثير الحقيقي (من حيث التوقع) ولكن قد تقلل من دقتها الإحصائية، وهو ما يُقبل إلى حد ما [21].
قامت معظم الدراسات المشمولة بتعديل العوامل المربكة من خلال إدخال جميع عوامل الخطر في نموذج انحدار متعدد المتغيرات، مما يشير إلى أن جميع عوامل الخطر تم تعديلها بشكل متبادل. هذه الطريقة مناسبة فقط عندما تكون جميع عوامل الخطر المدروسة مرتبطة ببعضها البعض.
الذي يعتمد على العلاقات بينها. إذا كانت هناك علاقة أحادية الاتجاه بين أي عاملين من عوامل الخطر المدروسة (مثل العمر وارتفاع ضغط الدم)، فإن الروابط المبلغ عنها قد تكون محيرة (تسمى “مغالطة الجدول 2”)، حيث تعتبر العلاقة لارتفاع ضغط الدم “أثرًا كليًا” بينما تعتبر العلاقة للعمر “أثرًا مباشرًا” [8]. لذلك، ستسبب هذه الطريقة انحيازًا بسبب التعديل المفرط لعوامل الخطر العليا (مثل الجنس، العمر، التعليم، التاريخ العائلي)، لأن تعديل العوامل النسبية
قد تؤثر عوامل المخاطر السفلية (مثل العوامل السلوكية، الأمراض) على الوسطاء. بالمقابل، إذا لم يكن هناك علاقة أحادية الاتجاه بين عوامل المخاطر المدروسة، بل كانت هناك علاقة وشاركوا نفس مجموعة العوامل المربكة، كما هو الحال بين عوامل نمط الحياة (مثل التدخين، النظام الغذائي، استهلاك الكحول والنشاط البدني)، فإن التعديل المتبادل يكون معقولًا [25]. ومع ذلك، فإن الغالبية العظمى (أكثر من
بعض الدراسات المشمولة قد قامت بتعديل العوامل المربكة نفسها بشكل منفصل لجميع عوامل المخاطر. معظمها قامت فقط بتعديل العوامل المربكة الأساسية، مثل العمر والجنس [2628]، مما قد يؤدي إلى تعديل غير كافٍ عندما لا تكون هذه هي مجموعة التعديل الأدنى الكافية لبعض عوامل المخاطر. بينما قامت النسبة الصغيرة المتبقية من الدراسات بتعديل المتغيرات بالإضافة إلى العوامل المربكة الأساسية، كان ذلك مناسبًا فقط عندما كانت عوامل المخاطر المدروسة مستقلة عن بعضها البعض وشاركت نفس مجموعة العوامل المربكة. خلاف ذلك، قد يؤدي ذلك إلى كل من التعديل غير الكافي والتعديل غير الضروري. بالإضافة إلى ذلك، بسبب ضعف الإبلاغ عن تعديل العوامل المربكة، في الدراسات التي قامت بتعديل نفس العوامل المربكة، كان التعديل المتبادل بينها غير واضح [29-31]. لذلك، ستقدم هذه الدراسات التحيزات المذكورة أعلاه بناءً على ممارسات التعديل الفعلية الخاصة بها.
بالمقارنة مع الدراسات التي تستكشف عوامل المخاطر المحتملة (توليد الفرضيات)، فإن تلك التي تفحص عدة عوامل مخاطر محددة (مدفوعة بالفرضيات) استخدمت بشكل متكرر نهج المعرفة السابقة لاختيار العوامل المربكة، واتبعت الطريقة الموصى بها لتعديل العوامل المربكة، وغالبًا ما تم نشرها في مجلات Q1. يمكن أن يُعزى ذلك إلى عدة أسباب. أولاً، كانت الدراسات التي تفحص عدة عوامل مخاطر محددة أكثر احتمالًا أن تشمل مؤلفين متخصصين في علم الأوبئة أو الإحصاء الحيوي، الذين يمكن أن يعززوا جودة تعديل العوامل المربكة. ثانيًا، كانت النتائج المختارة أمراضًا شائعة (أمراض القلب والأوعية الدموية، السكري والخرف)، والتي تم دراستها بشكل موسع بالفعل لعوامل المخاطر المحتملة. وبالتالي، قد لا تُعطى الأولوية للدراسات التي تستكشف عوامل المخاطر المحتملة للنشر في المجلات ذات التأثير العالي. أخيرًا، كانت المجلات ذات التأثير العالي أكثر احتمالًا لفرض الامتثال لقوائم التحقق من الإبلاغ وأن يتم مراجعة الطلبات من قبل علماء الأوبئة أو الإحصائيين الحيويين.
بالإضافة إلى ذلك، كانت جميع الدراسات العشر التي استخدمت الطريقة الموصى بها لتعديل العوامل المربكة دراسات تفحص عدة عوامل مخاطر محددة (توليد الفرضيات). على الرغم من أن الدراسات التي تستكشف عوامل المخاطر المحتملة تهدف إلى توليد الفرضيات، وغالبًا ما تستخدم الدلالة الإحصائية كمعيار لتحديد عوامل المخاطر المحتملة، إلا أنه لا يزال من الضروري تعديل العوامل المربكة وفقًا لقواعد تعديل العوامل المربكة (مثل: لا يمكن تعديل الوسطاء). خلاف ذلك، قد يتم
إخفاء بعض العوامل المحتملة، كما هو موضح في مثالنا المذكور سابقًا (الملف الإضافي 1: الجداول S1). علاوة على ذلك، في الدراسات التي تولد الفرضيات، بينما قد لا يتم التعرف على العلاقات بين عوامل المخاطر المختلفة والنتيجة بشكل صريح، فإن العلاقات عبر العديد من هذه عوامل المخاطر غالبًا ما تكون راسخة جيدًا (مثل: الجنس، العمر، مستوى التعليم، التدخين واستخدام الكحول)؛ لذلك، يجب تجنب التعديل غير المناسب.
التوصيات والآثار
كانت الأساليب المعتمدة على البيانات، مثل التحليل الأحادي المتغير والأساليب التدريجية، تُستخدم بشكل شائع لاختيار المتغيرات. لا يمكن لهذه الأساليب التمييز بين العوامل المربكة، التي تتطلب تعديلًا، والوسطاء، الذين لا يحتاجون؛ لذلك، تؤدي هذه الأساليب إلى تعديل متبادل بين المتغيرات المختارة، مما يزيد من خطر إدخال تحيز التعديل وإنتاج استنتاجات سببية غير صحيحة [17]. عندما تكون أحجام العينات كبيرة بما فيه الكفاية، نوصي بالاعتماد حصريًا على الأساليب المعتمدة على المعرفة. بينما تعتبر الأساليب المعتمدة على البيانات ضرورية لمجموعات البيانات الصغيرة والأحداث النادرة، يجب دمجها مع الأساليب المعتمدة على المعرفة قبل التطبيق.
هناك مجال كبير لتحسين شفافية الإبلاغ عن تعديل العوامل المربكة. نوصي بشدة المؤلفين باتباع بيان تعزيز الإبلاغ عن الدراسات الرصدية في علم الأوبئة (STROBE). يجب على المجلات اتخاذ إجراءات لتحسين جودة الإبلاغ. كانت الاستراتيجية لتعزيز الشفافية في الإبلاغ عن الدراسات الرصدية،
التي نفذها محررو PLOS Medicine، توفر حلاً ممكنًا [32]. فهي تلزم المؤلفين بعدم الاكتفاء بإكمال قائمة التحقق من STROBE مع مراجع الصفحات، بل أيضًا تضمين نص ذي صلة مقتبس من المخطوطة لتوضيح امتثالهم لكل عنصر [32].
نقاط القوة والقيود
كانت هناك عدة قيود. أولاً، بدلاً من إجراء مراجعة منهجية، وهو ما يتجاوز نطاقنا، قمنا فقط بتضمين الدراسات المنشورة خلال السنوات الخمس الماضية وقيّدنا النتائج بثلاثة أمراض مزمنة شائعة، مما قد يحد من إمكانية تعميم نتائجنا. ومع ذلك، قمنا بتضمين 162 مقالة من 31 فئة مجلة، والتي نعتقد أنها يمكن أن توفر رؤى حول حالة تعديل العوامل المربكة الحالية للدراسات التي تحقق في عوامل الخطر المتعددة، إلى حد ما. ثانياً، نظراً لأن الدراسات المضمنة تغطي السنوات التي تشمل فترة جائحة COVID-19، فإن الجودة المنهجية للدراسات المضمنة قد تكون أقل نسبياً. ثالثاً، بسبب نقص الإرشادات أو التوصيات الموحدة لتعديل العوامل المربكة في الدراسات التي تحقق في عوامل الخطر المتعددة، حددنا طرقاً محتملة من الدراسات المضمنة وعرفنا النهج الموصى به دون تحقق رسمي (مثل استشارة خبراء خارجيين)، مما قد يقدم بالضرورة عنصر الذاتية. ومع ذلك، قمنا بتصنيف الطرق من خلال مناقشات جماعية واستشارة مع وبائي كبير وعرفنا الطريقة الموصى بها بناءً على مبادئ الاستدلال السببي العامة، مما قد يقلل من التصنيف الخاطئ. بالإضافة إلى ذلك، قدمنا مبررات مفصلة لتعديل العوامل المربكة في كل دراسة مضمنة لتعزيز الشفافية والموضوعية. رابعاً، في تقييم الطرق لتعديل العوامل المربكة، كانت حكمتنا مبنية فقط على ما إذا كانت العوامل المربكة قد تم تعديلها بشكل منفصل لكل عامل خطر، دون تقييم ملاءمة هذه العوامل المربكة المعدلة. أخيراً، لم نقيم اتجاه وحجم التحيز الذي تم إدخاله بواسطة الطرق غير المناسبة لتعديل العوامل المربكة على تقديرات التأثير. بينما كان هذا خارج نطاق دراستنا، إلا أنه مجال يستحق المزيد من الاستكشاف في الأبحاث المستقبلية.
الاستنتاجات
الدراسات المضمنة. استخدمت عدد قليل من الدراسات الطريقة الموصى بها، وهي تعديل العوامل المربكة بشكل منفصل لكل عامل خطر، في حين كانت التعديلات المتبادلة هي الطريقة الأكثر شيوعًا. أوصينا الباحثين بأخذ العوامل المربكة في الاعتبار لكل علاقة بين عامل الخطر والنتيجة بشكل منفصل، بدلاً من مجرد تضمين جميع العوامل في نموذج متعدد المتغيرات.
الاختصارات
| مرض القلب والأوعية الدموية | أمراض القلب والأوعية الدموية |
| داغ | رسم بياني موجه غير دوري |
| JCR | تقارير استشهاد المجلات |
| SCIE | فهرس الاقتباسات العلمية الموسع |
| ستروب | تعزيز تقارير الدراسات الرصدية في علم الأوبئة |
معلومات إضافية
شكر وتقدير
مساهمات المؤلفين
تمويل
توفر البيانات
الإعلانات
موافقة الأخلاقيات والموافقة على المشاركة
الموافقة على النشر
المصالح المتنافسة
تفاصيل المؤلف
نُشر على الإنترنت: 05 مارس 2025
References
- Hemkens LG, Ewald H, Naudet F, Ladanie A, Shaw JG, Sajeev G, loannidis JPA. Interpretation of epidemiologic studies very often lacked adequate consideration of confounding. J Clin Epidemiol. 2018;93:94-102.
- VanderWeele TJ, Shpitser I. On the definition of a confounder. Ann Stat. 2013;41(1):196-220.
- Lash TL, VanderWeele TJ, Haneuse S, Rothman KJ. Modern epidemiology, 4th edition. Lippincott Williams & Wilkins (LWW). 2021.
- Too G, Wen T, Boehme AK, Miller EC, Leffert LR, Attenello FJ, Mack WJ. D’Alton ME, Friedman AM: Timing and risk factors of postpartum stroke. Obstet Gynecol. 2018;131(1):70-8.
- Ismail M, Mok VC, Wong A, Au L, Yiu B, Wang Z, Chu WC, Chan AY, Fan FS, Ma SH, et al. Risk factors for delayed-onset dementia after stroke or transient ischemic attack-a five-year longitudinal cohort study. Int J Stroke. 2022;17(5):517-25.
- Sarfo FS, Ovbiagele B, Akpa O, Akpalu A, Wahab K, Obiako R, Komolafe M, Owolabi L, Ogbole G, Calys-Tagoe B, et al. Risk factor characterization of ischemic stroke subtypes among West Africans. Stroke. 2022;53(1):134-44.
- Lopez-Jaramillo P, Joseph P, Lopez-Lopez JP, Lanas F, Avezum A, Diaz R, Camacho PA, Seron P, Oliveira G, Orlandini A, et al. Risk factors, cardiovascular disease, and mortality in South America: a PURE substudy. Eur Heart J. 2022;43(30):2841-51.
- Westreich D, Greenland S. The table 2 fallacy: presenting and interpreting confounder and modifier coefficients. Am J Epidemiol. 2013;177(4):292-8.
- Gardner RC, Barnes DE, Li Y, Boscardin J, Peltz C, Yaffe K. Medical and psychiatric risk factors for dementia in veterans with and without traumatic brain injury (TBI): a nationwide cohort study. J Prev Alzheimers Dis. 2023;10(2):244-50.
- Mosing MA, Lundholm C, Cnattingius S, Gatz M, Pedersen NL. Associations between birth characteristics and age-related cognitive impairment and dementia: a registry-based cohort study. PLoS Med. 2018;15(7): e1002609.
- Tomata Y, Li X, Karlsson IK, Mosing MA, Pedersen NL, Hägg S. Joint impact of common risk factors on incident dementia: a cohort study of the Swedish Twin Registry. J Intern Med. 2020;288(2):234-47.
- Schisterman EF, Cole SR, Platt RW. Overadjustment bias and unnecessary adjustment in epidemiologic studies. Epidemiology. 2009;20(4):488-95.
- Peters SAE, Carcel C, Millett ERC, Woodward M. Sex differences in the association between major risk factors and the risk of stroke in the UK Biobank cohort study. Neurology. 2020;95(20):e2715-26.
- Millett ERC, Peters SAE, Woodward M. Sex differences in risk factors for myocardial infarction: cohort study of UK Biobank participants. BMJ. 2018;363: k4247.
- Xiang L, Zhou X, He R, Gao Y, Li M, Zeng S, Cao H, Wang X, Xu Y, Zhao G, et al. Medication status and related factors in essential tremor patients: a cross-sectional study in China. Neuroepidemiology. 2023;57(4):260-70.
- Green MJ, Popham F. Interpreting mutual adjustment for multiple indicators of socioeconomic position without committing mutual adjustment fallacies. BMC Public Health. 2019;19(1):10.
- Talbot D, Massamba VK. A descriptive review of variable selection methods in four epidemiologic journals: there is still room for improvement. Eur J Epidemiol. 2019;34(8):725-30.
- Robins JM, Greenland S. Identifiability and exchangeability for direct and indirect effects. Epidemiology. 1992;3(2):143-55.
- Tennant PWG, Murray EJ, Arnold KF, Berrie L, Fox MP, Gadd SC, Harrison WJ, Keeble C, Ranker LR, Textor J, et al. Use of directed acyclic graphs (DAGs) to identify confounders in applied health research: review and recommendations. Int J Epidemiol. 2021;50(2):620-32.
- Ferguson KD, McCann M, Katikireddi SV, Thomson H, Green MJ, Smith DJ, Lewsey JD. Evidence synthesis for constructing directed acyclic graphs (ESC-DAGs): a novel and systematic method for building directed acyclic graphs. Int J Epidemiol. 2020;49(1):322-9.
- VanderWeele TJ. Principles of confounder selection. Eur J Epidemiol. 2019;34(3):211-9.
- Evans D, Chaix B, Lobbedez T, Verger C, Flahault A. Combining directed acyclic graphs and the change-in-estimate procedure as a novel approach to adjustment-variable selection in epidemiology. BMC Med Res Methodol. 2012;12:156.
- van Zwieten A, Tennant PWG, Kelly-Irving M, Blyth FM, Teixeira-Pinto A, Khalatbari-Soltani S. Avoiding overadjustment bias in social epidemiology through appropriate covariate selection: a primer. J Clin Epidemiol. 2022;149:127-36.
- Staerk C, Byrd A, Mayr A. Recent methodological trends in epidemiology: no need for data-driven variable selection? Am J Epidemiol. 2024;193(2):370-6.
- Yang J, Qian F, Chavarro JE, Ley SH, Tobias DK, Yeung E, Hinkle SN, Bao W, Li M, Liu A, et al. Modifiable risk factors and long term risk of type 2 diabetes among individuals with a history of gestational diabetes mellitus: prospective cohort study. BMJ. 2022;378: e070312.
- Aradine EM, Ryan KA, Cronin CA, Wozniak MA, Cole JW, Chaturvedi S, Dutta TLM, Hou Y, Mehndiratta P, Motta M, et al. Black-White differences in ischemic stroke risk factor burden in young adults. Stroke. 2022;53(3):e66-9.
- Bahall M, Seemungal T, Legall G. Risk factors for first-time acute myocardial infarction patients in Trinidad. BMC Public Health. 2018;18(1):161.
- Ezquerra-Lázaro I, Cea-Soriano L, Giraldez-García C, Ruiz A, Franch-Nadal J, Diez-Espino J, Nogales P, Carramiñana F, Javier Sangros F, Regidor E. Lifestyle factors do not explain the difference on diabetes progression according to type of prediabetes: results from a Spanish prospective cohort of prediabetic patients. Diabetes Res Clin Pract. 2019;153:66-75.
- Pantell MS, Prather AA, Downing JM, Gordon NP, Adler NE. Association of social and behavioral risk factors with earlier onset of adult hypertension and diabetes. JAMA Netw Open. 2019;2(5): e193933.
- Kozela M, Doryńska A, Bobak M, Pająk A. Accumulation of psychosocial risk factors and incidence of cardiovascular disease: a prospective observation of the Polish HAPIEE cohort. Kardiol Pol. 2019;77(5):535-40.
- Yong HY, Mohd Shariff Z, Mohd Yusof BN, Rejali Z, Tee YYS, Bindels J, van der Beek EM. Independent and combined effects of age, body mass index and gestational weight gain on the risk of gestational diabetes mellitus. Sci Rep. 2020;10(1):8486.
- PLOS Medicine Editors. Observational studies: getting clear about transparency. PLoS Med. 2014:11(8):e1001711.
ملاحظة الناشر
يينيان قاو ولينغهوي شيانغ قدما مساهمة متساوية في هذا العمل وهما المؤلفان الأولان.
غوتشاو تشانغ وإيرين شينين وو قد ساهموا بالتساوي في هذا العمل وهما المؤلفان المراسلان.
*المراسلة:
قو تشاو زانغ
18801038718@163.com
إيرين شينين وو
irenexywu@csu.edu.cn
قائمة كاملة بمعلومات المؤلف متاحة في نهاية المقال- طرق اختيار المتغيرات المربكة: الطرق المستخدمة لاختيار المتغيرات المربكة للتحليل الانحداري المتعدد اللاحق، مع قواعد التصنيف المستندة إلى مراجعة سابقة [17].
طرق تعديل العوامل المربكة: الطرق المستخدمة للتعامل مع العوامل المربكة في تحليل الانحدار المتعدد المتغيرات، مع تطوير قواعد التصنيف بناءً على تلخيص الدراسات المشمولة.
التأثير الكلي: التأثير الكامل للتعرض من خلال جميع المسارات السببية إلى النتيجة [18].
التأثير المباشر: التأثير على بعض المسارات المحددة من خلال حجب بعض المسارات السببية لفهم الآلية [18].
الرسم البياني الموجه غير الدوري (DAG): DAG هو تمثيل بياني غير معلمي يوفر طريقة بسيطة وشفافة لتوضيح المسارات السببية بين التعرض والنتيجة وغيرها من المتغيرات المرافقة، مما يساعد بشكل فعال في اختيار المتغيرات المربكة [19،20].
معيار السبب المنفصل المعدل: هذه طريقة أكثر عملية لاختيار المتغيرات المربكة، والتي تشمل: التحكم في المتغيرات التي تسبب عامل الخطر، أو النتيجة، أو كليهما؛ استبعاد المتغيرات الآلية المعروفة؛ وضم المتغيرات التي تعمل كبدائل للمتغيرات غير المقاسة التي هي أسباب شائعة لكل من عامل الخطر والنتيجة [21].
تعديل غير كافٍ: التعديل لا يأخذ في الاعتبار جميع العوامل المربكة ذات الصلة بشكل كافٍ (لم يتم اعتبار العوامل المربكة غير المقاسة في هذه الدراسة)؛ لذلك، فإن التحيز الناتج عن العوامل المربكة لا يتم معالجته بشكل كافٍ [22]. سيسبب التعديل غير الكافي تحيزًا متبقيًا ويمكن أن يؤدي إلى تقديرات منخفضة، تقديرات مرتفعة، وحتى تقديرات معكوسة [23].
تحيز الإفراط في التعديل: يحدث التحيز عند التعديل لمتوسط أو وكلائه اللاحقين، مما يؤدي عادةً إلى تقدير متحيز صفري للأثر السببي.
تعديل غير ضروري: التعديل للمتغيرات التي لا تؤثر على التأثير السببي المعني (في التوقع) ولكن قد تقلل من دقتها الإحصائية. قد يحدث ذلك عند التعديل للمتغيرات التي هي خارج الشبكة السببية المعنية تمامًا (C1)، تسبب فقط التعرض (C2)، هي المتغيرات التابعة للتعرض ولكنها ليست في المسار السببي (C3) أو تسبب فقط النتيجة (C4) [12]. من بينها، وفقًا لمعيار السبب المنفصل المعدل [21]، يمكن اختيار C2 و C4 للتعديل على المتغيرات المربكة.
DOI: https://doi.org/10.1186/s12916-025-03957-8
PMID: https://pubmed.ncbi.nlm.nih.gov/40038753
Publication Date: 2025-03-05
Confounder adjustment in observational studies investigating multiple risk factors: a methodological study
Abstract
Background Confounder adjustment is critical for accurate causal inference in observational studies. However, the appropriateness of methods for confounder adjustment in studies investigating multiple risk factors, where the factors are not simply mutually confounded, is often overlooked. This study aims to summarise the methods for confounder adjustment and the related issues in studies investigating multiple risk factors. Methods A methodological study was performed. We searched PubMed from January 2018 to March 2023 to identify cohort and case-control studies investigating multiple risk factors for three chronic diseases (cardiovascular disease, diabetes and dementia). Study selection and data extraction were conducted independently by two reviewers. The study objectives were grouped into two categories: widely exploring potential risk factors and examining specific risk factors. The methods for confounder adjustment were classified based on a summarisation of the included studies, identifying six categories: (1) each risk factor was adjusted for potential confounders separately (the recommended method); (2) all risk factors were mutually adjusted (i.e. including all factors in a multivariable model); (3) all risk factors were adjusted for the same confounders separately; (4) all risk factors were adjusted for the same confounders with some factors being mutually adjusted; (5) all risk factors were adjusted for the same confounders with mutual adjustment among them being unclear; and (6) unable to judge. All data were descriptively analysed. Results A total of 162 studies were included, with 88 (54.3%) exploring potential risk factors and 74 (45.7%) examining specific risk factors. The current status of confounder adjustment was unsatisfactory: only ten studies (6.2%) used the recommended method, all of which aimed at examining several specific risk factors; in contrast, mutual adjustment was adopted in over 70% of the studies. The remaining studies either adjusted for the same confounders across all risk factors, or unable to judge.
Keywords Confounder adjustment, Observational studies, Multiple risk factors, Methodological study
Background
confounding one another. Therefore, the set of confounders is specific to each risk factor-outcome relationship.
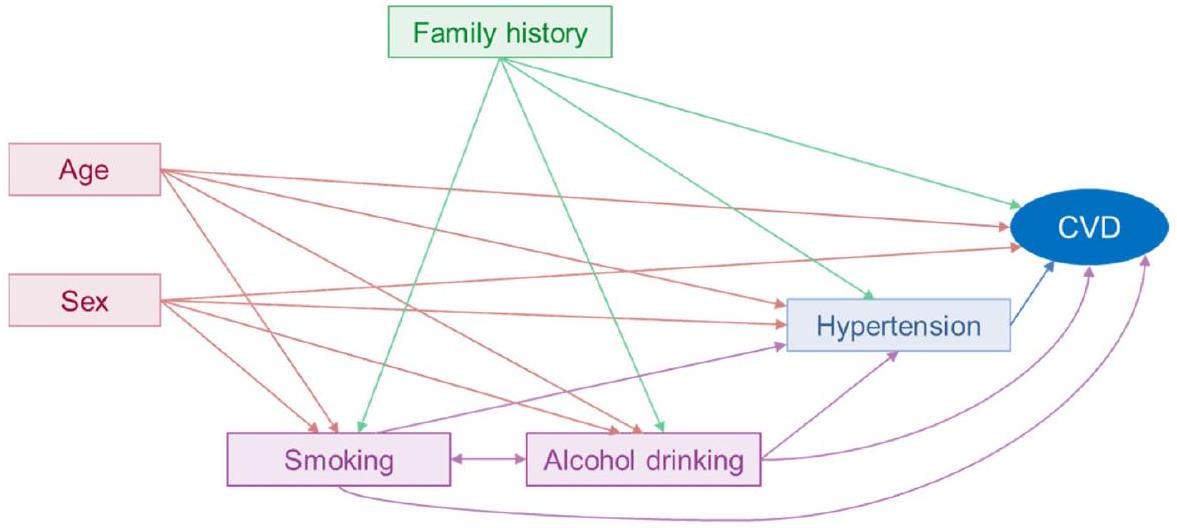
In observational studies, multivariable regression models are commonly used to estimate the exposure-outcome effects, or “independent associations”, by including the interested factor and potential confounders in the model. Studies investigating multiple risk factors involve multiple risk factor-outcome relationships with different confounders; therefore, according to the principles of confounder identification and adjustment [3], it is appropriate to adjust for confounders specific to each relationship separately, thereby requiring multiple multivariable regression models. However, previous studies investigating multiple risk factors often overlooked the specific role of each risk factor in the associations between other risk factors and the outcome. For instance, substantial studies included all studied risk factors into a multivariable
Sex → CVD: none
Age → CVD: none
Family history → CVD: none
Smoking → CVD: sex, age, family history, alcohol drinking
Alcohol drinking → CVD: sex, age, family history, smoking
Hypertension → CVD: sex, age, family history, smoking, alcohol drinking
Notes: A confounder is a common cause of both the exposure and the outcome, and is not a mediator that is caused by the exposure and in turn causes the outcome. Additionally, we did not present other potential confounders (such as genes, additional behaviours, and mental health) in the graph.
model [4-7]. This approach means all risk factors were mutually adjusted, which might lead to coefficients for some factors measuring the “total effect” while others measure the “direct effect”, potentially resulting in misleading effect estimates (i.e. the “Table 2 fallacy”) [8]. Another common practice is to adjust the same confounders separately for all studied risk factors, which might also be inappropriate [9-12]. In contrast, adjusting for potential confounders for each risk factor separately was rarely seen in published studies [13, 14].
Inappropriate confounder adjustment may underestimate, overestimate or even reverse the effect size. We illustrated this with a comparison of the effect estimates between two methods of confounder adjustment: adjusting for potential confounders separately for each risk factor and mutual adjustment for all risk factors. We conducted this comparison using the data from our previously published study that explored potential factors associated with medication intake in essential tremor patients [15]. As shown in Additional file 1: Table S1, the two adjustment methods present differences in the effect estimates for certain variables (e.g. sex, education, intention tremor). In addition, Green and Popham also illustrated that mutual adjustment for multiple socioeconomic indicators (education, occupation and income) could lead to “mutual adjustment fallacy”, making the mutually adjusted coefficients for each indicator incomparable [16]. While we acknowledge that these findings might be biased due to the cross-sectional design and limited number of studies, they highlighted the critical importance of appropriately adjusting for confounders to ensure accurate effect estimates in studies investigating multiple risk factors.
Methods
Eligibility criteria
We included all studies that met the following criteria: (1) the study design was cohort study or case-control study; (2) the study objective was to investigate multiple risk/protective factors (at least three factors), which were grouped into widely exploring potential risk factors (hypothesis-generating) and examining the associations of several specific risk factors with an outcome (hypothesis-driven) [24]; (3) the participants were adults (age
Search strategy and study selection
Data extraction
Classification rules on methods for confounder adjustment
are presented in Table 2. Since studies investigating multiple risk factors involve multiple factor-outcome relationships, confounders should be adjusted separately for each relationship based on the principles of confounder adjustment [3]; therefore, category
Data analysis
Results
Description of studies
The basic characteristics of the included studies are displayed in Table 3. Of the 162 studies,
A. Each risk factor was adjusted for potential confounders separately [recommended]
Example 2 (65): “For age at cancer diagnosis, the model adjusted for BMI, CCI, race/ethnicity, baseline tobacco use, education, and histology. For baseline BMI, CCI, the models adjusted for race/ethnicity, baseline tobacco use, education, rural residence, age at diagnosis, and family history of CVD. For education, the model adjusted for race/ethnicity, and rural residence. For baseline tobacco use, the model adjusted for race/ethnicity, education, and rural residence.”
B. All risk factors were separately adjusted for the same confounders
Example 1 (14): “Logistic regression was used to calculate age-adjusted OR.”
Example 2 (116): “We estimated the main effects of education, cardiovascular health, and APOE genotype on dementia risk in the full sample in separate models adjusting for baseline age, race, and sex.”
Example 3 (126): “Demographics-adjusted association (adjusted for race, sex, income, and education).”
B-b. All risk factors were separately adjusted for the same potential confounders
Example 1 (145): “Each of the above factors was included in a separate multivariable regression model, adjusting for sex, hypertension, diabetes mellitus…”
Example 2 (155): “Four models were fitted for each of the birth characteristics: (1) without any covariates; (2) corrected for sex, year of birth, parity, and age of mother; (3) corrected for birth SES in addition to the covariates included in model 2; and (4) corrected for education level in addition to all covariates included in model 3.”
C. All risk factors were mutually adjusted (i.e. including all factors in a multivariable model)
Example 1 (13): “Multivariable Cox proportional hazards regression analysis was used to calculate hazard ratios with mutual adjustment for the included risk factors.”
Example 2 (104): “Factors with
Example 3 (151): “The adjusted model included all risk factors.”
C-b. For studies that examined several specific risk factors, all risk factors were mutually adjusted on the basis of adjusting for basic confounders Example 1 (17): “We included all the risk factors in addition to age.”
Example 2 (20): “Risk factors were mutually adjusted, and we further adjusted for age, sex, and race.”
Example 3 (118): “Any variable with
C-c. For studies that examined several specific risk factors, all risk factors were mutually adjusted on the basis of adjusting for potential confounders Example 1 (117): “Models were adjusted for age, sex, race and ethnicity, education, presence of health care insurance, and all risk factors included in this analysis.”
Example 2 (127): “Each lifestyle factor adjusted for age, sex, education, body mass index, and history of hypertension, hypercholesterolemia and diabetes, and mutually adjusted for the other lifestyle factors and sleep duration.”
Example 3 (148): “Factors with a p-value of <0.05 on the univariate analysis were included in a multivariate logistic regression analysis.”
D. For studies that examined several specific risk factors, all risk factors were adjusted for the same confounders, with mutual adjustment among them being unclear
Example 2 (157): “The model was adjusted for sex, age, systolic and diastolic blood pressures, total and HDL cholesterol, diabetes, smoking, lipid-lowering, antihypertensive and rheumatic-specific drug use.”
E. All risk factors were adjusted for the same variables, with some risk factors being mutually adjusted
F. Unable to judge
Notes: In the above classification of confounder adjustment methods, the meanings of specific terms are as follows: risk factors, the studied risk factors; confounders, the variables adjusted for in the multivariable regression model, thus the confounders might also be the studied risk factors, or other variables beyond these risk factors
BMI body mass index, CCI Charlson Comorbidity Index, CVD cardiovascular disease, OR odds ratio, HDL high-density lipoprotein, ALT alanine aminotransferase
risk factors, those that examined several specific risk factors were more likely to have large sample sizes, be published in Q1 journals and include authors from the
Methods for confounder selection
factors. Notably, in all included studies, only two utilised a causal graph to select confounders.
Methods for confounder adjustment
Among the studies that widely explored potential risk factors, the majority (
| Characteristics | Widely explored potential risk factors (
|
Examined several specific risk factors (
|
| Study design | ||
| Cohort study | 66 (75.0) | 57 (77.0) |
| Case-control study | 22 (25.0) | 17 (23.0) |
| Sample size | ||
| <200 | 9 (10.2) | 2 (2.7) |
| 200~ | 15 (17.1) | 5 (6.8) |
|
|
17 (19.3) | 4 (5.4) |
| 1000~ | 30 (34.1) | 27 (36.5) |
| 10,000~ | 17 (19.3) | 36 (48.7) |
| Journal Impact Factor quartiles in publication year | ||
| Q1 | 34 (38.6) | 47 (63.5) |
| Top 5% | 4 (4.5) | 12 (16.2) |
| Q2 | 28 (31.8) | 22 (29.7) |
| Q3 and Q4 | 26 (29.5) | 5 (6.8) |
| Region of the first author | ||
| Europe | 19 (21.6) | 23 (31.1) |
| North America | 18 (20.5) | 19 (25.7) |
| Asia | 36 (40.9) | 28 (37.8) |
| Others | 15 (17.1) | 4 (5.4) |
| Degree of the first author | ||
| Doctor’s degree | 29 (33.0) | 33 (44.6) |
| Master’s or bachelor’s degree | 8 (9.1) | 3 (4.1) |
| No information | 51 (58.0) | 38 (51.4) |
| Affiliation type of the last corresponding author | ||
| University | 51 (58.0) | 48 (64.9) |
| Hospital | 11 (12.5) | 2 (2.7) |
| Research institute | 2 (2.3) | 1 (1.4) |
| Both university and other institute | 23 (26.1) | 20 (27.0) |
| Others | 1 (1.1) | 3 (4.1) |
| Including authors from epidemiology or biostatistics | ||
| Yes | 16 (18.2) | 39 (52.7) |
| No | 51 (58.0) | 23 (31.1) |
| Unknown | 21 (23.9) | 12 (16.2) |
| Is there a unidirectional relationship between any two of the studied risk factors? | ||
| Yes | 88 (100) | 51 (68.9) |
| Probably yes | 0 (0) | 14 (18.9) |
| No or unsure | 0 (0) | 9 (12.2) |
| Selected outcome | ||
| Cardiovascular diseases | 57 (64.8) | 40 (54.1) |
| Diabetes | 26 (29.6) | 11 (14.9) |
| Dementia | 5 (5.7) | 23 (31.1) |
confounders (category
| Methods for confounder selection | Studies widely explored potential risk factors (
|
Studies examined several specific risk factors (
|
Total |
| Prior knowledge only | 24 (27.3) | 60 (81.1) | 84 (51.9) |
| Using causal graphs | 1 (1.1) | 1 (1.4) | 2 (1.2) |
| Data-driven approaches only | 28 (31.8) | 2 (2.7) | 30 (18.5) |
| Univariate analyses only | 15 (17.0) | 1 (1.4) | 16 (9.9) |
| Stepwise only | 9 (10.2) | 0 (0) | 9 (5.6) |
| Both univariate analysis and stepwise | 3 (3.4) | 1 (1.4) | 4 (2.5) |
| Other (e.g. change in estimate) | 1 (1.1) | 0 (0) | 1 (0.6) |
| Both prior knowledge and data-driven approaches | 20 (22.7) | 10 (13.5) | 30 (18.5) |
| Using causal graphs | 0 (0) | 0 (0) | 0 (0) |
| Insufficient information to judge | 16 (18.2) | 2 (2.7) | 18 (11.1) |
| Methods for confounder adjustment | Studies widely explored potential risk factors (
|
Studies examined several specific risk factors (
|
| A. Each risk factor was adjusted for potential confounders separately | 0 (0) | 10 (13.5) |
| B. All risk factors were separately adjusted for the same confounders | ||
| B-a. All risk factors were separately adjusted for the same basic confounders | 2 (2.3) | 5 (6.8) |
| B-b. All risk factors were separately adjusted for the same potential confounders | 0 (0) | 3 (4.1) |
| C. All risk factors were mutually adjusted | ||
| C-a. For studies that widely explored potential risk factors, all risk factors were mutually adjusted | 77 (87.5) | NA |
| C-b. For studies that examined several specific risk factors, all risk factors were mutually adjusted on the basis of adjusting for basic confounders | NA | 22 (29.7) |
| C-c. For studies that examined several specific risk factors, all risk factors were mutually adjusted on the basis of adjusting for potential confounders | NA | 21 (28.4)
|
| D. For studies that examined several specific risk factors, all risk factors were adjusted for the same confounders, with mutual adjustment being unclear | NA |
|
| E. All risk factors adjusted for same variables, with some risk factors being mutually adjusted | 1 (1.1) | 1 (1.4) |
| F. Unable to judge | 8 (9.1) | 0 (0) |
factors not being mutually adjusted (category B-a, 6.8%; category
Figure 3 illustrates the relationship between the methods for confounder selection and adjustment. All studies that adjusted for confounders for each risk factor separately (category
variable selection methods that rely solely on data-driven approaches directly lead to mutual adjustment.
Table 6 outlines the characteristics of comparisons between the recommended method and other categories. In general, studies that used the recommended method to adjust for confounders were more likely to have a large sample size (
Additional file 1: Tables S4 and S5 detail the methods for confounder adjustment in studies published in the top 5% of journals and high-impact medical and
Discussion
risk factor; notably, all of these aimed at examining several specific risk factors. The most prevalent category was mutual adjustment for all risk factors. Regarding methods used for confounder selection, studies examining several specific risk factors relied on prior knowledge more frequently and data-driven approaches less frequently, compared to studies that widely explored potential risk factors.
Observations and remarks
| Characteristics | Studies that adopted the recommended method or not | |
| Adopted (
|
Not adopted (
|
|
| Study design | ||
| Cohort study | 10 (100) | 114 (75.0) |
| Case-control study | 0 (0) | 38 (25.0) |
| Sample size | ||
| <200 | 0 (0) | 11 (7.2) |
| 200~ | 0 (0) | 20 (13.1) |
|
|
0 (0) | 21 (13.8) |
| 1000~ | 2 (20.0) | 55 (36.2) |
| 10,000~ | 8 (80.0) | 45 (29.6) |
| Journal Impact Factor quartiles | ||
| Q1 | 9 (90.0) | 72 (47.4) |
| Top 5% | 2 (20.0) | 14 (9.2) |
| Q2 | 1 (10.0) | 49 (32.2) |
| Q3 and Q4 | 0 (0) | 31 (20.4) |
| Region of the first author | ||
| Europe | 5 (50.0) | 37 (24.3) |
| North America | 2 (20.0) | 35 (23.0) |
| Asia | 2 (20.0) | 62 (40.8) |
| Others | 1 (10.0) | 18 (11.8) |
| Degree of the first author | ||
| Doctor’s degree | 4 (40.0) | 58 (38.2) |
| Master’s or bachelor’s degree | 1 (40.0) | 10 (6.6) |
| No information | 5 (40.0) | 84 (55.3) |
| Affiliation type of the corresponding author | ||
| University | 8 (80.0) | 86 (56.6) |
| Hospital | 1 (10.0) | 17 (11.2) |
| Research institute | 0 (0) | 3 (2.0) |
| Both university and other institute | 1 (10.0) | 42 (27.6) |
| Others | 0 (0) | 4 (2.6) |
| Including authors from epidemiology or biostatistics | ||
| Yes | 7 (70.0) | 48 (31.6) |
| No | 2 (20.0) | 72 (47.4) |
| Unknown | 1 (10.0) | 32 (21.1) |
and overadjustment may mask the true effect of interest, while unnecessary adjustment does not affect the true effect (in expectation) but may reduce its statistical precision, which is acceptable to some extent [21].
Most of the included studies adjusted for confounders by entering all risk factors into a multivariable regression model, indicating that all risk factors were mutually adjusted. This method is appropriate only when all the studied risk factors are confounded with each other,
which depends on the relationships among them. If there is a unidirectional relationship between any two of the studied risk factors (e.g. age and hypertension), the reported associations can be puzzling (called “Table 2 fallacy”), as the association for hypertension is considered a “total effect” while the association for age is “direct effect” [8]. Therefore, this method would cause overadjustment bias for the upstream risk factors (e.g. sex, age, education, family history), because the adjustment of relatively
downstream risk factors (e.g. behavioural factors, diseases) might adjust for mediators. In contrast, if there is no unidirectional relationship between the studied risk factors, but rather a correlation and shared the same set of confounders, as seen among lifestyle factors (such as smoking, diet, alcohol consumption and physical activity), the mutual adjustment is reasonable [25]. However, the vast majority (more than
Some included studies have separately adjusted for the same confounders for all risk factors. Most of them only adjusted for basic confounders, such as age and sex [2628], which might lead to insufficient adjustment when these were not the minimally sufficient adjustment set for some risk factors. While the remaining small fraction of studies adjusted for variables in addition to basic confounders, this was only appropriate when the studied risk factors were independent of each other and shared the same set of confounders. Otherwise, this may lead to both insufficient adjustment and unnecessary adjustment. In addition, due to the poor reporting on confounder adjustment, in studies that adjusted for the same confounders, mutual adjustment among them was unclear [29-31]. Therefore, these studies would introduce the aforementioned biases based on their actual adjustment practices.
In comparison to studies exploring potential risk factors (hypothesis-generating), those examining several specific risk factors (hypothesis-driven) more frequently utilised a prior knowledge approach for confounder selection, employed the recommended method for confounder adjustment and were more often published in Q1 journals. This could be attributed to several reasons. First, studies examining several specific risk factors were more likely to involve authors specialised in epidemiology or biostatistics, who could enhance the quality of confounder adjustment. Second, the selected outcomes were common diseases (CVD, diabetes and dementia), which have already been extensively studied for potential risk factors. Thus, studies exploring potential risk factors might not be prioritised for publication in high-impact journals. Finally, the high-impact journals were more likely to enforce compliance with reporting checklists and have submissions reviewed by epidemiologists or biostatisticians.
In addition, all ten studies that used the recommended method for confounder adjustment were studies examining several specific risk factors (hypothesis-generating). Although studies exploring potential risk factors aim to generating hypotheses, often using statistical significance as the criterion for identifying potential risk factors, it is still necessary to adjust for confounders following the confounder adjustment rules (e.g. cannot adjust for mediators). Otherwise, some potential factors may be
obscured, as shown in our previously mentioned example (Additional file 1: Tables S1). Furthermore, in hypothesisgenerating studies, while relationships between various risk factors and the outcome may not be explicitly recognised, the relationships across many of these risk factors are often well-established (e.g. gender, age, education level, smoking and alcohol use); therefore, inappropriate adjustment should be avoided.
Recommendations and implications
Data-driven approaches, such as univariate analysis and stepwise methods, were commonly used to select variables. These methods cannot distinguish between confounders, which require adjustment, and mediators, which do not; therefore, these methods lead to mutual adjustment among the selected variables, increasing the risk of introducing adjustment bias and producing invalid causal inferences [17]. When sample sizes are large enough, we recommend relying exclusively on knowledge-based approaches. While data-driven methods are essential for small datasets and rare events, they should be integrated with knowledge-based approaches before application.
There is considerable room for improving the transparency of reporting on confounder adjustment. We strongly recommend authors to follow the Strengthening the Reporting of Observational Studies in Epidemiology (STROBE) statement. Journals should take action to improve the reporting quality. The strategy for advancing transparency in the reporting of observational studies,
implemented by the PLOS Medicine editors, provided a possible solution [32]. It mandates authors to not only complete the STROBE checklist with page references but also incorporate relevant text excerpted from the manuscript to elucidate their compliance with each item [32].
Strengths and limitations
There were several limitations. First, instead of conducting a systematic review, which is out of our scope, we only included studies published within the last 5 years and restricted the outcomes to three common chronic diseases, which may limit the generalisability of our findings. Nonetheless, we included 162 articles from 31 journal categories, which we believe can provide insight into the current confounder adjustment status of studies investigating multiple risk factors, to some extent. Second, due to the included studies spanning the years covering the period of the COVID-19 pandemic, therefore the methodological quality of the included studies might be relatively lower. Third, due to the lack of standardised guidelines or recommendations for confounder adjustment in studies investigating multiple risk factors, we identified potential methods from the included studies and defined the recommended approach without formal validation (e.g. external expert consultation), which may inevitably introduce subjectivity. However, we classified the methods through group discussions and consultation with a senior epidemiologist and defined the recommended method based on general causal inference principles, which could reduce misclassification. Additionally, we provided detailed justifications for confounder adjustment in each included study to enhance transparency and objectivity. Fourth, in assessing the methods for confounder adjustment, our judgement was based solely on whether confounders were adjusted separately for each risk factor, without evaluating the appropriateness of these adjusted confounders. Lastly, we did not assess the direction and magnitude of the bias introduced by the inappropriate methods for confounder adjustment on the effect estimates. While this was beyond the scope of our study, it is an area that warrants further exploration in future research.
Conclusions
the included studies. Only a few studies employed the recommended method, specifically, adjusting for confounders separately for each risk factor, whereas mutual adjustment was the most commonly adopted method. We recommended researchers consider confounders for each risk factor-outcome relationship separately, rather than simply including all factors in a multivariable model.
Abbreviations
| CVD | Cardiovascular diseases |
| DAG | Directed acyclic graph |
| JCR | Journal Citation Reports |
| SCIE | Science Citation Index Expanded |
| STROBE | Strengthening the Reporting of Observational Studies in Epidemiology |
Supplementary Information
Acknowledgements
Authors’ contributions
Funding
Data availability
Declarations
Ethics approval and consent to participate
Consent to publication
Competing interests
Author details
Published online: 05 March 2025
References
- Hemkens LG, Ewald H, Naudet F, Ladanie A, Shaw JG, Sajeev G, loannidis JPA. Interpretation of epidemiologic studies very often lacked adequate consideration of confounding. J Clin Epidemiol. 2018;93:94-102.
- VanderWeele TJ, Shpitser I. On the definition of a confounder. Ann Stat. 2013;41(1):196-220.
- Lash TL, VanderWeele TJ, Haneuse S, Rothman KJ. Modern epidemiology, 4th edition. Lippincott Williams & Wilkins (LWW). 2021.
- Too G, Wen T, Boehme AK, Miller EC, Leffert LR, Attenello FJ, Mack WJ. D’Alton ME, Friedman AM: Timing and risk factors of postpartum stroke. Obstet Gynecol. 2018;131(1):70-8.
- Ismail M, Mok VC, Wong A, Au L, Yiu B, Wang Z, Chu WC, Chan AY, Fan FS, Ma SH, et al. Risk factors for delayed-onset dementia after stroke or transient ischemic attack-a five-year longitudinal cohort study. Int J Stroke. 2022;17(5):517-25.
- Sarfo FS, Ovbiagele B, Akpa O, Akpalu A, Wahab K, Obiako R, Komolafe M, Owolabi L, Ogbole G, Calys-Tagoe B, et al. Risk factor characterization of ischemic stroke subtypes among West Africans. Stroke. 2022;53(1):134-44.
- Lopez-Jaramillo P, Joseph P, Lopez-Lopez JP, Lanas F, Avezum A, Diaz R, Camacho PA, Seron P, Oliveira G, Orlandini A, et al. Risk factors, cardiovascular disease, and mortality in South America: a PURE substudy. Eur Heart J. 2022;43(30):2841-51.
- Westreich D, Greenland S. The table 2 fallacy: presenting and interpreting confounder and modifier coefficients. Am J Epidemiol. 2013;177(4):292-8.
- Gardner RC, Barnes DE, Li Y, Boscardin J, Peltz C, Yaffe K. Medical and psychiatric risk factors for dementia in veterans with and without traumatic brain injury (TBI): a nationwide cohort study. J Prev Alzheimers Dis. 2023;10(2):244-50.
- Mosing MA, Lundholm C, Cnattingius S, Gatz M, Pedersen NL. Associations between birth characteristics and age-related cognitive impairment and dementia: a registry-based cohort study. PLoS Med. 2018;15(7): e1002609.
- Tomata Y, Li X, Karlsson IK, Mosing MA, Pedersen NL, Hägg S. Joint impact of common risk factors on incident dementia: a cohort study of the Swedish Twin Registry. J Intern Med. 2020;288(2):234-47.
- Schisterman EF, Cole SR, Platt RW. Overadjustment bias and unnecessary adjustment in epidemiologic studies. Epidemiology. 2009;20(4):488-95.
- Peters SAE, Carcel C, Millett ERC, Woodward M. Sex differences in the association between major risk factors and the risk of stroke in the UK Biobank cohort study. Neurology. 2020;95(20):e2715-26.
- Millett ERC, Peters SAE, Woodward M. Sex differences in risk factors for myocardial infarction: cohort study of UK Biobank participants. BMJ. 2018;363: k4247.
- Xiang L, Zhou X, He R, Gao Y, Li M, Zeng S, Cao H, Wang X, Xu Y, Zhao G, et al. Medication status and related factors in essential tremor patients: a cross-sectional study in China. Neuroepidemiology. 2023;57(4):260-70.
- Green MJ, Popham F. Interpreting mutual adjustment for multiple indicators of socioeconomic position without committing mutual adjustment fallacies. BMC Public Health. 2019;19(1):10.
- Talbot D, Massamba VK. A descriptive review of variable selection methods in four epidemiologic journals: there is still room for improvement. Eur J Epidemiol. 2019;34(8):725-30.
- Robins JM, Greenland S. Identifiability and exchangeability for direct and indirect effects. Epidemiology. 1992;3(2):143-55.
- Tennant PWG, Murray EJ, Arnold KF, Berrie L, Fox MP, Gadd SC, Harrison WJ, Keeble C, Ranker LR, Textor J, et al. Use of directed acyclic graphs (DAGs) to identify confounders in applied health research: review and recommendations. Int J Epidemiol. 2021;50(2):620-32.
- Ferguson KD, McCann M, Katikireddi SV, Thomson H, Green MJ, Smith DJ, Lewsey JD. Evidence synthesis for constructing directed acyclic graphs (ESC-DAGs): a novel and systematic method for building directed acyclic graphs. Int J Epidemiol. 2020;49(1):322-9.
- VanderWeele TJ. Principles of confounder selection. Eur J Epidemiol. 2019;34(3):211-9.
- Evans D, Chaix B, Lobbedez T, Verger C, Flahault A. Combining directed acyclic graphs and the change-in-estimate procedure as a novel approach to adjustment-variable selection in epidemiology. BMC Med Res Methodol. 2012;12:156.
- van Zwieten A, Tennant PWG, Kelly-Irving M, Blyth FM, Teixeira-Pinto A, Khalatbari-Soltani S. Avoiding overadjustment bias in social epidemiology through appropriate covariate selection: a primer. J Clin Epidemiol. 2022;149:127-36.
- Staerk C, Byrd A, Mayr A. Recent methodological trends in epidemiology: no need for data-driven variable selection? Am J Epidemiol. 2024;193(2):370-6.
- Yang J, Qian F, Chavarro JE, Ley SH, Tobias DK, Yeung E, Hinkle SN, Bao W, Li M, Liu A, et al. Modifiable risk factors and long term risk of type 2 diabetes among individuals with a history of gestational diabetes mellitus: prospective cohort study. BMJ. 2022;378: e070312.
- Aradine EM, Ryan KA, Cronin CA, Wozniak MA, Cole JW, Chaturvedi S, Dutta TLM, Hou Y, Mehndiratta P, Motta M, et al. Black-White differences in ischemic stroke risk factor burden in young adults. Stroke. 2022;53(3):e66-9.
- Bahall M, Seemungal T, Legall G. Risk factors for first-time acute myocardial infarction patients in Trinidad. BMC Public Health. 2018;18(1):161.
- Ezquerra-Lázaro I, Cea-Soriano L, Giraldez-García C, Ruiz A, Franch-Nadal J, Diez-Espino J, Nogales P, Carramiñana F, Javier Sangros F, Regidor E. Lifestyle factors do not explain the difference on diabetes progression according to type of prediabetes: results from a Spanish prospective cohort of prediabetic patients. Diabetes Res Clin Pract. 2019;153:66-75.
- Pantell MS, Prather AA, Downing JM, Gordon NP, Adler NE. Association of social and behavioral risk factors with earlier onset of adult hypertension and diabetes. JAMA Netw Open. 2019;2(5): e193933.
- Kozela M, Doryńska A, Bobak M, Pająk A. Accumulation of psychosocial risk factors and incidence of cardiovascular disease: a prospective observation of the Polish HAPIEE cohort. Kardiol Pol. 2019;77(5):535-40.
- Yong HY, Mohd Shariff Z, Mohd Yusof BN, Rejali Z, Tee YYS, Bindels J, van der Beek EM. Independent and combined effects of age, body mass index and gestational weight gain on the risk of gestational diabetes mellitus. Sci Rep. 2020;10(1):8486.
- PLOS Medicine Editors. Observational studies: getting clear about transparency. PLoS Med. 2014:11(8):e1001711.
Publisher’s Note
Yinyan Gao and Linghui Xiang contributed equally to this work and are the first authors.
Guochao Zhang and Irene Xinyin Wu contributed equally to this work and are the corresponding authors.
*Correspondence:
Guochao Zhang
18801038718@163.com
Irene Xinyin Wu
irenexywu@csu.edu.cn
Full list of author information is available at the end of the article- Methods for confounder selection: The methods used to select confounders for the subsequent multivariable regression analysis, with the classification rules drawing on a previous review [17].
Methods for confounder adjustment: The methods employed to handle confounders in multivariable regression analysis, with the classification rules being developed based on the summarisation of included studies.
Total effect: The entire effect of an exposure through all causal pathways to the outcome [18].
Direct effect: The effect for certain specific pathways by blocking some causal pathways to understand the mechanism [18].
Directed acyclic graph (DAG): DAG is a non-parametric diagrammatic representation that provides a simple and transparent way to illustrate the causal paths between the exposure, outcome and other covariates, effectively aiding in the selection of confounders [19,20].
Modified disjunctive cause criterion: This is a more practical method for confounder selection, which includes: controlling for variables that cause the risk factor, the outcome or both; excluding known instrumental variables; and including covariates that act as proxies for unmeasured variables that are common causes of both the risk factor and outcome [21].
Insufficient adjustment: The adjustment does not adequately account for all relevant confounders (unmeasured confounders were not considered in this study); therefore, the confounding bias is not adequately addressed [22]. Insufficient adjustment will cause residual confounding bias and can yield underestimates, overestimates and even sign-reversed estimates [23].
Overadjustment bias: A bias occurs when adjusting for a mediator or its downstream proxies, typically leading to a null-biased estimate of the causal effect [12].
Unnecessary adjustment: Adjusting for variables that do not impact the causal effect of interest (in expectation) but may reduce its statistical precision. It may occur when adjusting for variables that are completely outside the interested causal network (C1), only cause the exposure (C2), are the descendent variables of the exposure but not in the causal pathway (C3) or only cause outcome (C4) [12]. Of which, according to the modified disjunctive cause criterion [21], C2 and C4 can be selected for confounder adjustment.