دليل العملية للدراسات الاستنتاجية باستخدام بيانات الرعاية الصحية من الممارسة السريرية الروتينية لتقييم التأثيرات السببية للأدوية (PRINCIPLED): اعتبارات من مركز الابتكار في FDA Sentinel Process guide for inferential studies using healthcare data from routine clinical practice to evaluate causal effects of drugs (PRINCIPLED): considerations from the FDA Sentinel Innovation Center

المجلة: BMJ
DOI: https://doi.org/10.1136/bmj-2023-076460
PMID: https://pubmed.ncbi.nlm.nih.gov/38346815
تاريخ النشر: 2024-02-12

دليل العملية للدراسات الاستنتاجية باستخدام بيانات الرعاية الصحية من الممارسة السريرية الروتينية لتقييم التأثيرات السببية للأدوية (PRINCIPLED): اعتبارات من مركز الابتكار في FDA Sentinel

ريشي ج. ديساي، شيرلي ف. وانغ سوشاما كاتيناكير سريدها لوك زابوتكا فارزين خسروخاور جينيفر سي نيلسون شو شي سينغوي توه، ريتشارد وايس إليزابيتا باتورنو، سارة دوتشر، جي لي، هانا لي روبرت بال جيرالد دال بان جودي ب. سيغال سامي سويصا كينيث ج. روثمان ساندر غرينلاند ميغيل أ. هيرنان باتريك ج. هيغرتي سيباستيان شنيوايس

لرؤية الانتماءات المرقمة، انظر نهاية المقال
المراسلة إلى: ر. ج. ديسايrdesai@bwh.harvard.edu (أو @RishiDesai11 على تويتر؛ ORCID 0000-0003-0299-7273)
المواد الإضافية تُنشر عبر الإنترنت فقط. لعرضها، يرجى زيارة المجلة على الإنترنت.
استشهد بهذا كـ: BMJ2024;384:e076460
http://dx.doi.org/10.1136/
bmj-2023-076460
تم القبول: 11 ديسمبر 2023

الملخص

يقترح هذا التقرير عملية خطوة بخطوة تغطي مجموعة من الاعتبارات للنظر بشكل منهجي في الخيارات الرئيسية لتصميم الدراسة وتحليل البيانات للدراسات غير التدخلية مع الهدف المركزي المتمثل في تعزيز توليد أدلة موثوقة وقابلة للتكرار. تشمل هذه الخطوات (1) صياغة سؤال سببي محدد جيدًا من خلال تحديد بروتوكول التجربة المستهدفة؛ (2) وصف محاكاة كل مكون من مكونات بروتوكول التجربة المستهدفة وتحديد البيانات المناسبة؛ (3) تقييم الدقة المتوقعة وإجراء تقييمات تشخيصية؛ (4) تطوير خطة لتقييمات القوة بما في ذلك تحليلات الحساسية الحتمية، وتحليلات التحيز الكمي، وتقييم التحيز الصافي؛ و(5) التحليلات الاستنتاجية.

نقاط الملخص

تقدم الدراسات غير التدخلية (المعروفة أيضًا بالدراسات الملاحظة) التي تُجرى باستخدام بيانات الرعاية الصحية التي يتم توليدها أثناء تقديم الرعاية السريرية الروتينية (بما في ذلك مطالبات التأمين الصحي والسجلات الصحية الإلكترونية) فرصة لسد الفجوات في الأدلة للأسئلة التي لم تُجب عليها التجارب العشوائية.
على الرغم من وجود العديد من أدوات التقييم والإرشادات المتاحة لتقييم صلاحية مثل هذه الدراسات غير التدخلية، إلا أنه لا يوجد أي منها يقترح دليلًا عمليًا لإجراء وتحليل هذه الدراسات.
PRINCIPLED (دليل العملية للدراسات الاستنتاجية باستخدام بيانات الرعاية الصحية من الممارسة السريرية الروتينية لتقييم التأثيرات السببية للأدوية) هو عملية خطوة بخطوة مقترحة للنظر بشكل منهجي في الخيارات الرئيسية لتصميم الدراسة وتحليل البيانات للدراسات غير التدخلية.
يمكن أن تُفيد العملية الموضحة هنا في توجيه إجراء الدراسات غير التدخلية، وتسهيل الاتصالات الشفافة بين مختلف الأطراف المعنية، وقد تحفز اعتبارات مماثلة لمجتمع البحث السريري.
تُجرى الدراسات غير التدخلية، المعروفة أيضًا بالدراسات الملاحظة، باستخدام مصادر بيانات العالم الحقيقي التي تشمل عادةً بيانات الرعاية الصحية التي يتم توليدها أثناء تقديم الرعاية السريرية الروتينية (بما في ذلك مطالبات التأمين الصحي والسجلات الصحية الإلكترونية). توفر هذه الدراسات فرصة لسد الفجوات في الأدلة للأسئلة التي لم تُجب عليها التجارب العشوائية. ومع ذلك، يتطلب توليد أدلة ذات جودة قرار من بيانات الرعاية الصحية إطارًا سببيًا قويًا لتجنب إدخال التحيز. تتوفر العديد من الأدوات التي تهدف إلى تحسين إجراء أو تقرير هذه الدراسات غير التدخلية. تناقش الوثائق الإرشادية العامة المنهجية للدراسات غير التدخلية – مثل أفضل الممارسات لدراسات السلامة الصيدلانية الوبائية من قبل إدارة الغذاء والدواء (FDA). وشبكة المراكز الأوروبية لعلم الأوبئة الدوائية واليقظة الدوائية (EncEPP) دليل المعايير المنهجية في علم الأوبئة الدوائية. أدوات تقييم الجودة مثل ROBINS-I وقائمة GRACE المساعدة في تقييم التحيز في الدراسات المنشورة. أدوات التقرير مثل RECORD-PE و STaRT-RWE توفير قوائم مراجعة أو قوالب منظمة لتسهيل الشفافية في تقارير البروتوكولات وإمكانية إعادة الإنتاج. أخيرًا، قالب البروتوكول الموحد HARPER مدعوم من قبل الجهات التنظيمية لتحسين التواصل حول المعايير الرئيسية للدراسة في الدراسات غير التدخلية، ويتم إيداعه في مواقع تسجيل البروتوكولات (مثل “مؤسسة العلوم المفتوحةOSF.ioوكالة الأدوية الأوروبيةENcEPP.eu). بينما تكون هذه الأدوات مفيدة لأغراضها المحددة، إلا أنها ليست مصممة بشكل صريح لتوجيه تصميم وإجراء الدراسات غير التدخلية التي تقيم سلامة وفعالية الأدوية باستخدام بيانات الرعاية الصحية.
أطر أخرى مثل LEGEND والخريطة السببية ت outline بعض المبادئ العامة الواسعة لتوليد الأدلة. ومع ذلك، فإنها تقدم إرشادات عملية محدودة حول الجوانب الحرجة لعملية توليد الأدلة، بما في ذلك تحديد ملاءمة مصدر البيانات، وتسجيل بروتوكولات الدراسة، والنظر في التعديلات المبدئية على مدار الدراسة، والتخطيط لتقييمات المتانة. لهذا الغرض، نقدم عملية خطوة بخطوة تغطي هذه الخيارات الرئيسية فيما يتعلق بالتصميم والتحليل التي يمكن أن تؤثر على صحة مثل هذه الدراسات. نبدأ مناقشتنا من خلال النظر في نظام FDA Sentinel، وهو
نظام المراقبة النشطة الوطني لما بعد التسويق لمنتجات الأدوية استخدام كميات كبيرة من بيانات الرعاية الصحية من مطالبات التأمين والسجلات الصحية الإلكترونية كحالة استخدام تمثيلية. تغطي العملية المكونة من خمس خطوات الموضحة في هذا التقرير صياغة سؤال سببي محدد جيدًا من خلال تحديد بروتوكول التجربة المستهدفة؛ وصف محاكاة كل مكون من مكونات بروتوكول التجربة المستهدفة وتحديد مصدر البيانات المناسب؛ تقييم الدقة المتوقعة وإجراء تقييمات تشخيصية؛ تطوير خطة لتقييمات القوة بما في ذلك تحليلات الحساسية الحتمية، وتحليلات التحيز الكمي، وتقييم التحيز الصافي؛ والتحليلات الاستنتاجية.

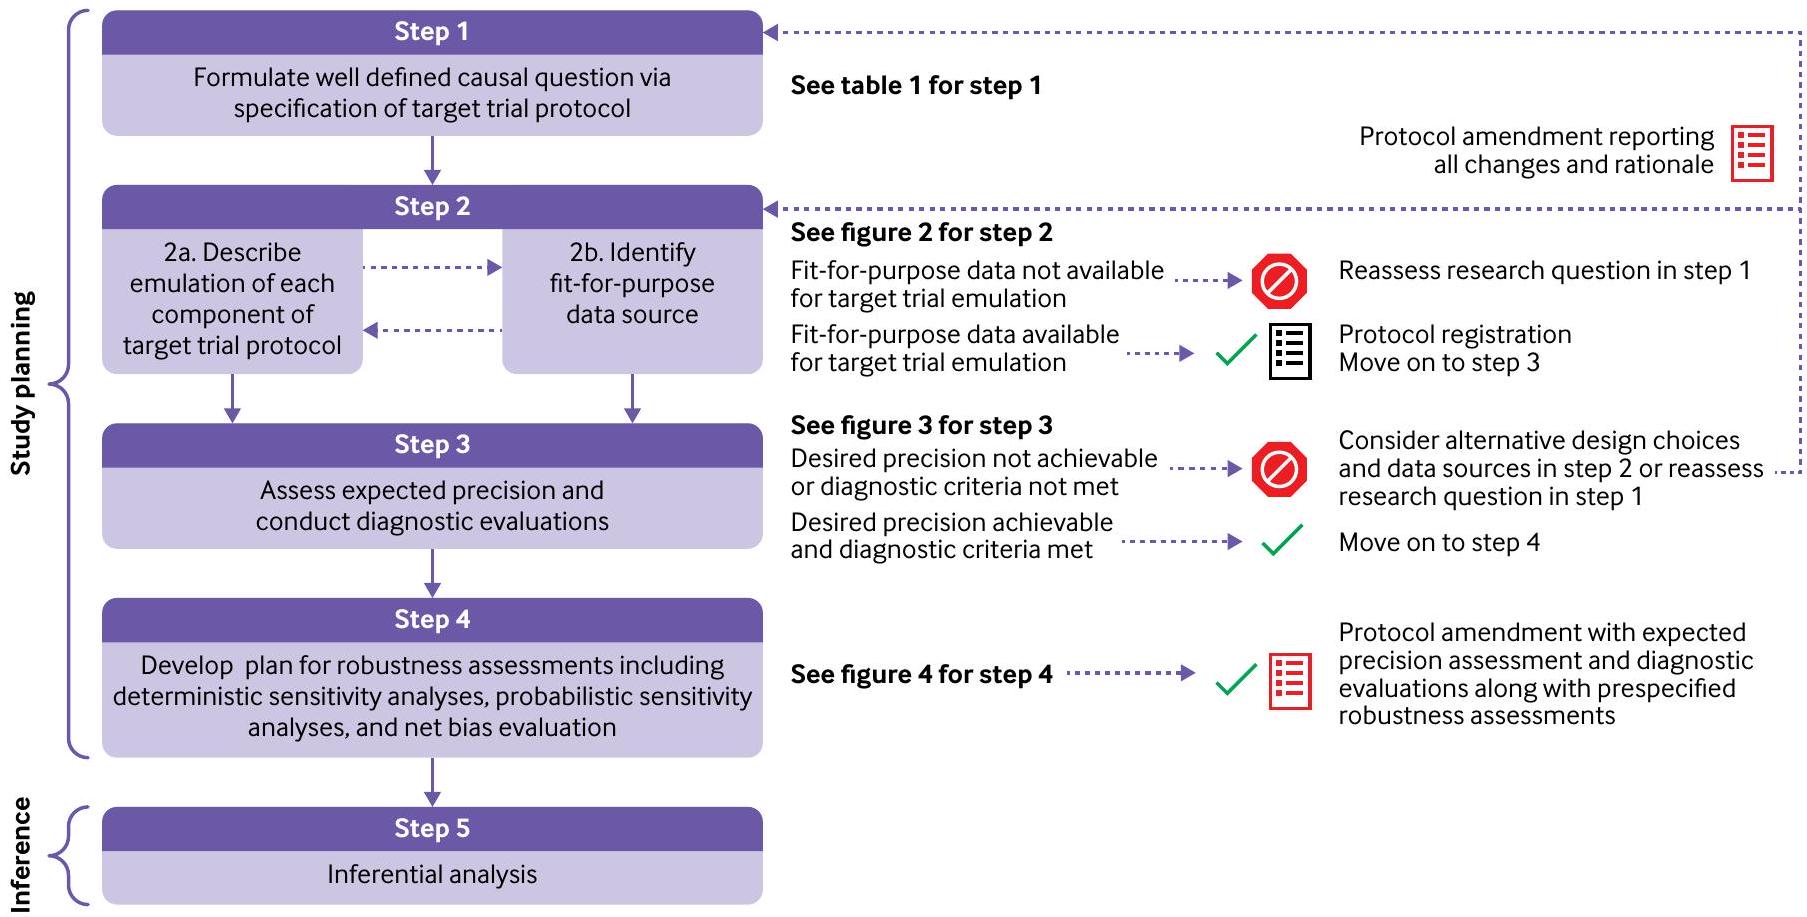
نظرة عامة على دليل العملية المقترح

PRINCIPLED (دليل العملية للدراسات الاستنتاجية باستخدام بيانات الرعاية الصحية من الممارسة السريرية الروتينية لتقييم التأثيرات السببية للأدوية) هو عملية من خمس خطوات للمساعدة في طرح والإجابة على سؤال سببي يتعلق بتأثيرات علاج الأدوية باستخدام بيانات الرعاية الصحية. نحن نميز بوضوح بين مرحلة تخطيط الدراسة (الخطوات 1-4) حيث لا يتم إجراء أي استنتاج، ومرحلة تحليل الدراسة (الخطوة 5) حيث يتم إجراء تحليلات استنتاجية بهدف استخلاص استنتاجات سببية. توضح الشكل 1 نظرة عامة على الخطوات المقترحة. تناقش الأقسام أدناه كل خطوة بالتفصيل. نحن نوضح تنفيذ كل خطوة من خلال مثال تقييم مثبطات ناقل الصوديوم والجلوكوز 2 (SGLT-2)، الأدوية المستخدمة لعلاج السكري من النوع 2، فيما يتعلق بالقلق المعروف بشأن سلامة العدوى التناسلية. بينما تأخذ هذه العملية في الاعتبار نهجًا عامًا تكراريًا لحل المشكلات عند ظهورها أثناء إجراء الدراسات غير التدخلية، قد تتطلب بعض الحالات اتخاذ إجراءات متعمدة.
الانحراف عن هذه الخطوات. حتى في الحالات التي لا يمكن فيها تنفيذ العملية بالكامل، يمكن إجراء دراسة معقولة، ولكن قد تحتاج بعض التنازلات إلى أن تُجرى.

الخطوة 1: صياغة سؤال سببي من خلال تحديد بروتوكول التجربة المستهدفة

طرح السؤال الصحيح بالطريقة الصحيحة يشكل الخطوة الأولى في أي عملية لاستنتاج الأسباب حول تأثيرات العلاج من البيانات الملاحظة. طريقة عملية لطرح سؤال سببي في الدراسات غير التدخلية هي تحديد بروتوكول التجربة المستهدفة، التجربة العملية التي ستجيب على السؤال السببي. من بين العناصر الرئيسية لبروتوكول التجربة المستهدفة التي يجب تحديدها هي معايير الأهلية، استراتيجيات العلاج، النتائج الأساسية ذات الاهتمام، تخصيص العلاج، بداية ونهاية المتابعة، والتباين السببي (مثل، تأثير النية للعلاج أو تأثير وفقًا للبروتوكول). إن التحديد الدقيق لبروتوكول التجربة المستهدفة أمر حاسم لأنه له آثار مباشرة في التحليل والتفسير. على سبيل المثال، تحدد معايير الأهلية المحددة السكان الذين ستنطبق عليهم النتائج. تلخص الجدول 1 بروتوكول التجربة المستهدفة الأساسي لدراسة حالة المثال لدينا.

الخطوة 2: وصف محاكاة كل مكون من بروتوكول التجربة المستهدفة وتحديد مصدر بيانات مناسب

تحديد المكونات الرئيسية لبروتوكول التجربة المستهدفة في الخطوة 1 يوضح قائمة بعناصر البيانات اللازمة لمحاكاتها. بعد ذلك، يجب تحديد العوامل المربكة اللازمة لمحاكاة العشوائية الأساسية. الرسوم البيانية السببية، مثل الرسوم البيانية السببية الموجهة غير الدائرية، مفيدة لاتخاذ القرارات.
الشكل 1 | نظرة عامة على دليل العملية للدراسات الاستنتاجية باستخدام بيانات الرعاية الصحية من الممارسة السريرية الروتينية
الجدول 1 | بروتوكول التجربة المستهدفة لدراسة حالة المثال التي تقيم تأثير مثبطات ناقل الصوديوم والجلوكوز 2 (SGLT-2) على العدوى التناسلية
عنصر التحديد المحاكاة باستخدام مصادر بيانات العالم الحقيقي
معايير الأهلية المرضى الذين يعانون من داء السكري من النوع 2؛ أعمارهم سنوات؛ عدم استخدام أدوية الدراسة قبل العشوائية؛ عدم وجود تاريخ لمرض الكلى في المرحلة النهائية، فيروس نقص المناعة البشرية، أو العدوى التناسلية؛ تسجيل مستمر في Medicare لمدة ستة أشهر ونتائج اختبار الهيموغلوبين الغليكوزيلاتي في السجلات الصحية الإلكترونية في ستة أشهر قبل بدء العلاج نفس بروتوكول التجربة المستهدفة
استراتيجيات العلاج
بدء (1) مثبطات SGLT-2 (كاناجليفلوزين، داباجليفلوزين، إمباغليفلوزين)؛ أو (2) مثبطات DPP-4 (ألوغليبتين، ليناغليبتين، ساكساجليبتين، سيتاجليبتين).
تحت كلا الاستراتيجيتين، يُترك استخدام العلاج المضاد للسكري بعد البدء لتقدير الطبيب وقرار المرضى
نفس بروتوكول التجربة المستهدفة
تخصيص العلاج عشوائي، غير مُعمى غير مُعمى ويفترض أنه عشوائي ضمن مستويات العوامل المربكة المقاسة*
بداية المتابعة (الوقت 0) عند التخصيص نفس بروتوكول التجربة المستهدفة
نهاية المتابعة الأول من نهاية المتابعة الإدارية (اليوم 365)، فقدان المتابعة، الوفاة، أو حدوث النتيجة نفس بروتوكول التجربة المستهدفة
النتيجة الأساسية العدوى التناسلية نفس بروتوكول التجربة المستهدفة
التباين السببي تأثير النية للعلاج (تأثير التخصيص للعلاج) نظير الملاحظة لتأثير النية للعلاج
SGLT-2=ناقل الصوديوم والجلوكوز 2؛ DPP-4=ديبيبتيديل ببتيداز-4؛ HbA1c=الهيموغلوبين الغليكوزيلاتي.
*تشمل العوامل المربكة المقاسة الخصائص الديموغرافية (العمر، الجنس، العرق، علامات الحالة الاجتماعية والاقتصادية)، متغيرات شدة السكري بما في ذلك المضاعفات الدقيقة والكبيرة، مقاييس تتعلق بالتحكم في السكري مثل , الحالات المصاحبة، العلاجات المشتركة، علامات السلوك الصحي، واستخدام الرعاية الصحية.
حول اختيار العوامل المربكة عندما تكون المعرفة المحتوى كافية. من المهم تجنب التعديل للعوامل المشتركة والمتغيرات الآلية.
بمجرد تحديد جميع عناصر البيانات، يحتاج الباحثون إلى وصف محاكاة كل مكون من بروتوكول التجربة المستهدفة من خلال تقديم وصف دقيق لتعريفات المتغيرات، بما في ذلك جميع الرموز والخوارزميات المستخدمة لمعايير الأهلية، استراتيجيات العلاج (بما في ذلك بدء العلاج وإيقافه)، النتائج، والعوامل المربكة (الخطوة 2أ). يجب أيضًا وصف تحليلات البيانات التي سيتم تنفيذها إذا كانت البيانات من التجربة المستهدفة متاحة بالتفصيل. تتوفر قوالب بروتوكول منظمة مثل STaRT-RWE وHARPER للمساعدة في الإبلاغ الشفاف عن بروتوكول الدراسة. يُقترح رسم تخطيطي للتصميم لتلخيص الجوانب التصميمية الطولية للدراسة بصريًا.
بعد ذلك، يحتاج الباحثون إلى تحديد مصادر بيانات مناسبة تحتوي على جميع عناصر البيانات اللازمة لمحاكاة ناجحة للتجربة المستهدفة (الخطوة 2ب). إن تحديد بروتوكول التجربة المستهدفة هو عملية تكرارية تعتمد على توفر البيانات لدعم المحاكاة. إذا لم يتم تضمين عناصر بيانات معينة في مصدر البيانات الذي يتم النظر فيه، يمكن للباحثين النظر في مصادر بيانات بديلة.
كمثال على اختيار بيانات مناسبة، نعتبر نظام Sentinel، الذي يحتوي على بيانات منظمة من مطالبات التأمين الصحي تمثل 844 مليون سنة شخص من الملاحظة بين عامي 2000 و2021 عبر شبكة كبيرة من مزودي البيانات، ويزداد غناه بمطالبات التأمين والبيانات المرتبطة من السجلات الصحية الإلكترونية. يوضح الشكل 2 نهجًا لتقييم ملاءمة الغرض الذي يتوافق مع توجيهات FDA المسودة للصناعة بشأن البيانات من العالم الحقيقي. هناك اعتباران رئيسيان هما ملاءمة البيانات وموثوقية البيانات. لتحديد الملاءمة، نعتبر سياق Sentinel حيث تأتي معظم البيانات من مطالبات التأمين، وتوفر المصادر المساعدة (بما في ذلك السجلات الصحية الإلكترونية)
فرصًا للتعزيز. في هذه الحالة، يعتمد تحديد الملاءمة على سلسلة من الأسئلة التي تركز على خصائص القياس لأربعة أنواع من المتغيرات المركزية في سؤال البحث المعني في بيانات مطالبات التأمين: معايير الأهلية، النتيجة، العلاج، والعوامل المربكة الرئيسية. إذا تم اعتبار قياس أي من هذه المتغيرات غير كافٍ، فسيكون من الضروري تعزيز مطالبات التأمين بمصادر بديلة مثل السجلات الصحية الإلكترونية المرتبطة. نصف أدناه الفروق الدقيقة المحددة عند النظر في هذه الأسئلة الأربعة الرئيسية.
  • السؤال 1: هل يمكن محاكاة معايير الأهلية بدقة كافية؟
    قد لا تكون بعض معايير الأهلية المحددة في بروتوكول التجربة المستهدفة (مثل بعض الحالات الطبية) قابلة للتحديد بشكل صريح في مطالبات التأمين وقد لا تكون خوارزمية تصنيف تم التحقق منها متاحة. في هذه الظروف، سيكون من الضروري الربط بالسجلات الصحية الإلكترونية لتطوير والتحقق من خوارزميات التصنيف التي تحدد الحالات الصحية المعنية باستخدام معلومات بديلة مستندة إلى المطالبات.
    على سبيل المثال، لا يمكن تحديد الأنواع الفرعية لفشل القلب المحفوظ والمخفض بشكل مباشر في مطالبات التأمين بسبب نقص قياسات الكسر القذفي. تم تطوير خوارزمية تصنيف احتمالية بناءً على مطالبات Medicare لتحديد الأنواع الفرعية للكسر القذفي لفشل القلب باستخدام مطالبات Medicare المرتبطة بالسجلات الصحية الإلكترونية من نظام الرعاية الصحية Mass General Brigham. أظهرت دقة عامة تبلغ في التمييز بين الأنواع الفرعية المحفوظة والمخفضة للكسر القذفي. سهل هذا النموذج نشر هذه الخوارزمية في بيانات مطالبات Medicare الوطنية لدراسة نتائج علاج الأدوية لهذه الفئات السكانية المحددة من الاهتمام. في الظروف التي تظهر فيها الخوارزمية المطورة أداءً دون المستوى، قد يكون من الضروري تقييد
الشكل 2 | تحديد مصادر البيانات المناسبة (الخطوة 2ب من دليل العملية للدراسات الاستنتاجية باستخدام بيانات الرعاية الصحية من الممارسة السريرية الروتينية). الهيموغلوبين الغليكوزيلاتي؛ السجلات الصحية الإلكترونية. *الجودة=الدقة فيما يتعلق بالتوقيت والكمال للعلاجات؛ القيمة المتوقعة الإيجابية، الحساسية، الخصوصية للنتائج الثنائية؛ النسبة المفقودة للنتائج المستمرة؛ بداية دقيقة للوقت حتى حدوث النتائج؛ وتوافر بيانات المتابعة طويلة الأجل للنتائج الكامنة
قد يكون من الضروري تقييد التحليل للأفراد الذين لديهم بيانات مرتبطة من مطالبات التأمين والسجلات الصحية الإلكترونية المتاحة وقياس مسبق لمعايير الأهلية لمنع التحيز على حساب قابلية النقل.
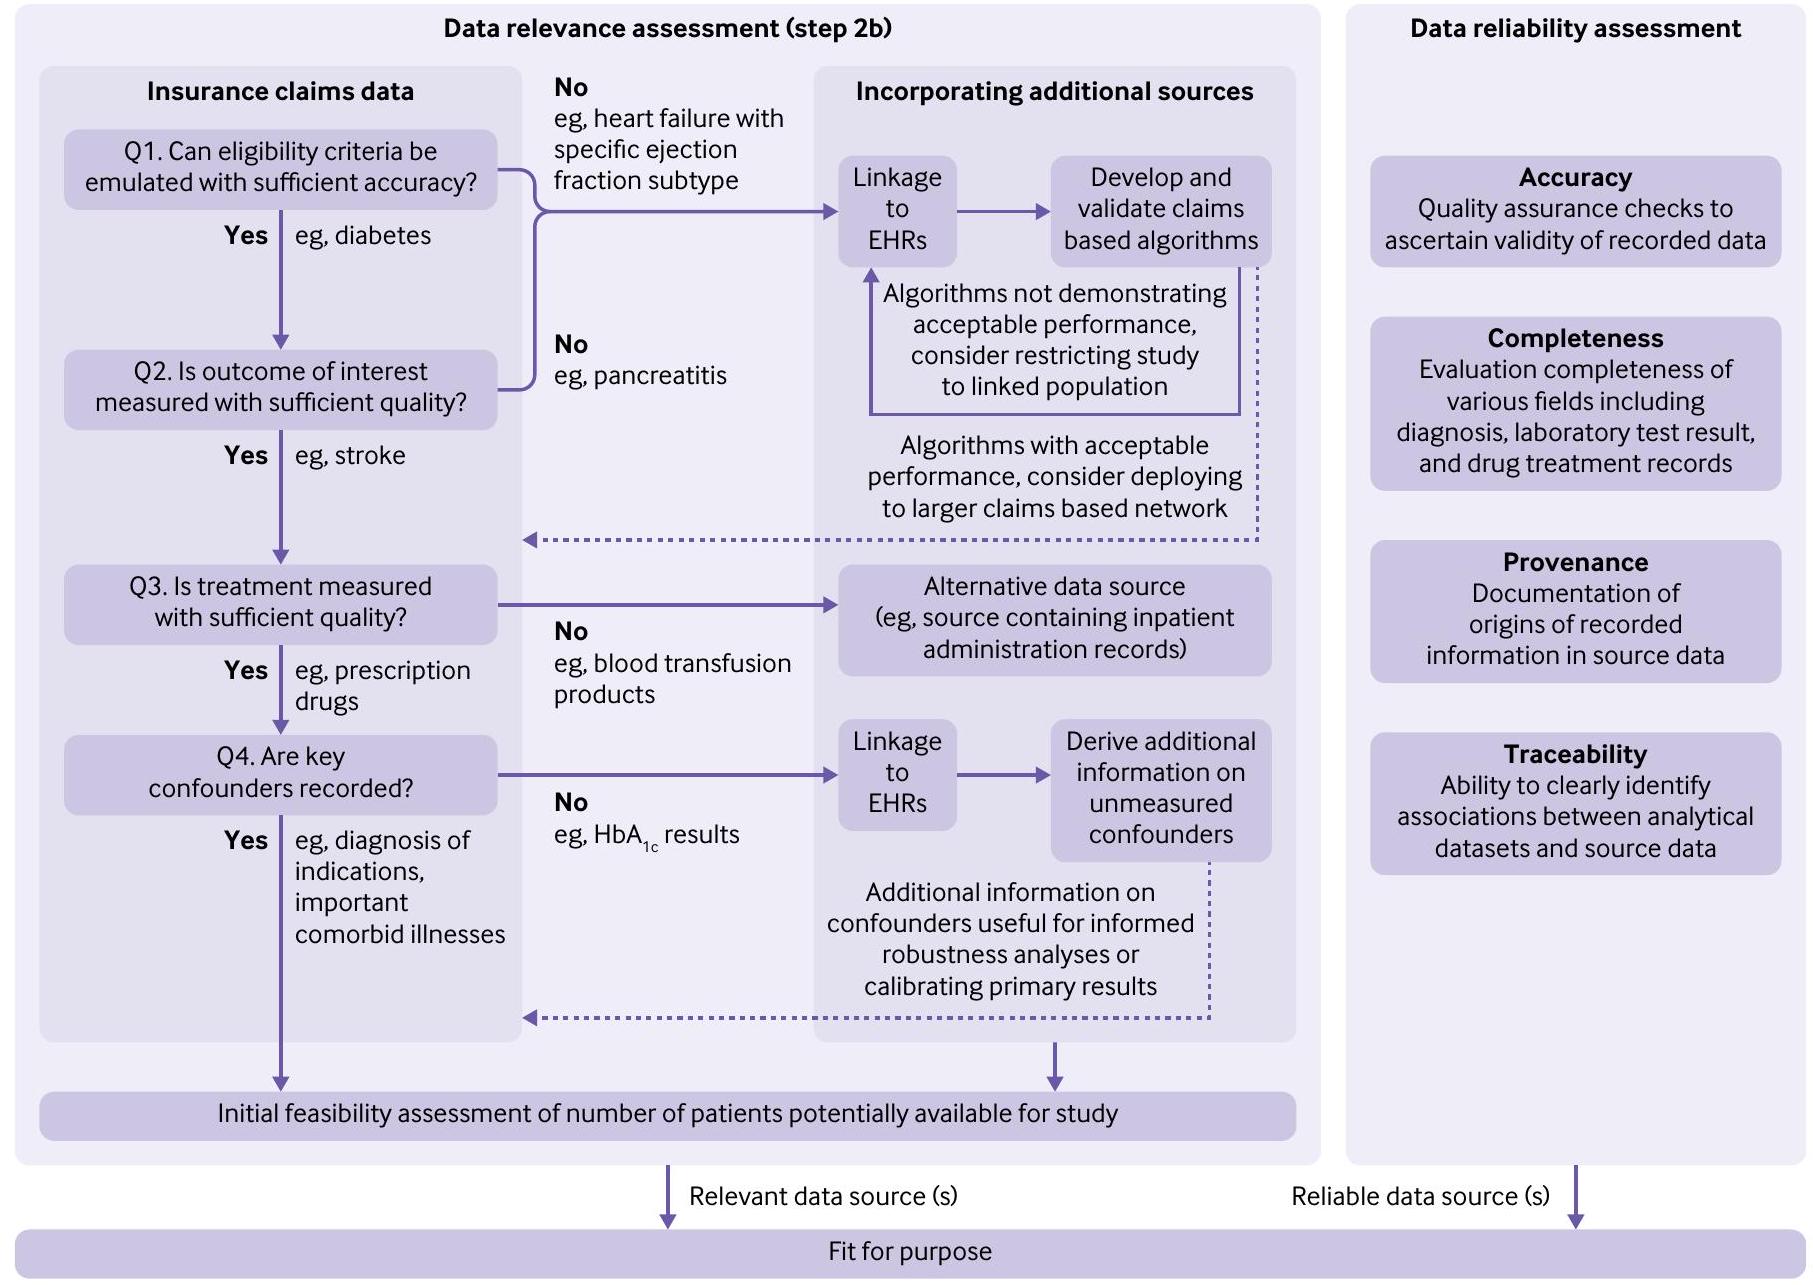
  • السؤال 2: هل تم قياس النتيجة المعنية بجودة كافية؟
    تعتمد جودة قياس النتيجة على القيمة المتوقعة الإيجابية للنتائج الثنائية، والنسبة المفقودة للنتائج المستمرة، والبداية الدقيقة للنتائج المتعلقة بالوقت. عادةً، قد يتم تسجيل الحالات الطبية الخطيرة (مثل السكتة الدماغية) بشكل كافٍ في مطالبات التأمين ; لكن النتائج الأخرى ليست كذلك، بما في ذلك تلك التي تتطلب نتائج اختبارات مختبرية تأكيدية (مثل، التهاب البنكرياس الحاد ) أو معلومات سياقية من ملاحظات نصية حرة (مثل، الأفكار الانتحارية ). بالنسبة لمثل هذه النتائج، يتطلب الأمر تعزيز البيانات من خلال ربط مطالبات التأمين بالسجلات الصحية الإلكترونية.
يمكن تطوير وتحسين والتحقق من صحة خوارزميات تحديد النتائج (بما في ذلك تلك التي تستخدم فقط معلومات قائمة على المطالبات) بناءً على مراجعات السجلات باستخدام السجلات الصحية الإلكترونية المرتبطة. إذا أظهرت خوارزمية تستخدم فقط معلومات قائمة على المطالبات أداءً مقبولاً، يمكن تطبيق مثل هذه الخوارزمية على مصدر بيانات مطالبات التأمين الأكبر. في الحالات التي تكون فيها خوارزميات قائمة على المطالبات غير كافية ولكن مصادر السجلات الصحية الإلكترونية توفر تعزيزًا كافيًا لتحديد النتيجة، يمكن للباحثين النظر في تقييد سكانهم للمرضى الذين لديهم سجلات مرتبطة بمطالبات السجلات الصحية الإلكترونية. يمكن أن تكون الأحكام حول الجودة المطلوبة لكي تعتبر الخوارزمية كافية للاستخدام في الاستدلال ذات طابع شخصي؛ ومع ذلك، قد لا يكون تنفيذ قاعدة مبسطة حول معايير الأداء (مثل، القيمة المتوقعة الإيجابية) مفيدًا. سواء للمضي قدمًا في التحليل هو قرار متعدد الأبعاد ويأخذ في الاعتبار عوامل مثل مدى إلحاح المعلومات المطلوبة
وشدة الحدث الضار. معرفة خصائص القياس من خلال التحقق في السجلات الصحية الإلكترونية المرتبطة، حتى عندما تكون دون المستوى الأمثل، سيمكن من تحليل التحيز الكمي. تُعطى مزيد من التفاصيل حول تحليل التحيز الكمي أدناه في الخطوة 4. في التحليلات التي تمتد عبر شبكة من قواعد البيانات، قد تحتاج قابلية نقل خوارزميات القياس وخصائص القياس عبر قواعد البيانات إلى أن تُظهر.
  • السؤال 3: هل تم قياس العلاج بجودة كافية؟
    تشير جودة القياس لعلاج معين إلى دقة التسجيل في بيانات مطالبات التأمين فيما يتعلق بالتوقيت والكمال. بالنسبة للعديد من المنتجات مثل علاجات الأدوية الموصوفة للمرضى الخارجيين، تكون مطالبات التأمين عمومًا كافية لالتقاط العلاج من خلال سجلات صرف الأدوية الخارجية. ومع ذلك، فإن مثال العلاج الذي غالبًا ما يتم تسجيله بشكل غير كافٍ في المطالبات هو منتجات نقل الدم. في مثل هذه الظروف، هناك حاجة إلى مصادر بيانات بديلة تحتوي على معلومات حول الإدارات الداخلية للإجابة على سؤال البحث. إذا كانت استراتيجيات العلاج الديناميكية تتم مقارنتها، يجب أن تكون العوامل السريرية المتغيرة مع الزمن المستخدمة لتعريف الاستراتيجيات متاحة أيضًا.
  • السؤال 4: هل تم تسجيل العوامل المربكة الرئيسية؟
إذا لم يتم قياس عامل مربك قوي بشكل كافٍ في مطالبات التأمين، قد تحتاج إلى النظر في تعزيز البيانات باستخدام السجلات الصحية الإلكترونية أو نتائج اختبارات المختبر. على سبيل المثال، قد تتطلب نتائج اختبار الهيموغلوبين الغليكوزيلاتي لأساس دراسة تقارن بين علاجين لخفض الجلوكوز فيما يتعلق بنتيجة سلبية تعزيزًا. قد تكون المعلومات الإضافية حول العوامل المربكة التي تم الحصول عليها من خلال التعزيز مفيدة لتقييم الإمكانية لوجود تداخل غير مسيطر عليه، ولإجراء تحليلات إضافية مثل المعايرة الإحصائية لنتائج الدراسة لدمج المعرفة حول العوامل المربكة غير المقاسة.
تفي مصادر البيانات بالمعايير الأساسية للملاءمة، ربما من خلال استراتيجيات تعزيز مختلفة إذا لزم الأمر، عندما تقدم معايير أهلية موصوفة بوضوح، ونتائج أولية، وعلاج، وعوامل مربكة رئيسية. بالإضافة إلى ذلك، قد تكون هناك حاجة إلى تقييم أولي للجدوى لعدد المرضى المتاحين المحتملين للدراسة لضمان الملاءمة. على سبيل المثال، قد تشمل هذه التقييمات تقييمًا أوليًا لعدد المستخدمين الجدد لعلاجات الأدوية المدروسة في مصدر البيانات (المصادر) التي يتم النظر فيها.
الجانب الثاني لملاءمة مصدر البيانات هو موثوقية البيانات، والتي تشمل تقييمات الدقة، والكمال، والأصل، وقابلية تتبع بيانات المصدر (الشكل 2). داخل Sentinel، يتم إجراء هذه التقييمات في المراحل السابقة عند تحويل
البيانات الخام من المصادر المساهمة إلى نموذج البيانات المشترك لـ Sentinel – والذي يُستخدم بعد ذلك لجميع التحليلات اللاحقة. يمكن اعتبار مصادر البيانات التي تلبي معايير الملاءمة والموثوقية ملائمة للغرض لسؤال الدراسة المعني.
إذا لم يكن من الممكن محاكاة كل مكون من بروتوكول التجربة المستهدفة باستخدام مصدر البيانات الذي يتم النظر فيه، يمكن للباحثين إعادة تقييم السؤال في الخطوة 1 من خلال تحديد بروتوكول تجربة مستهدفة معدلة تتطلب مجموعة مختلفة من عناصر البيانات مع الاستمرار في طرح سؤال سببي ذي أهمية. يُشجع الباحثون على تسجيل جميع تقييمات ملاءمة البيانات وموثوقية البيانات لتتبع القرارات التصميمية الرئيسية التي تؤدي إلى اختيار بيانات ملائمة للغرض يمكن أن تدعم محاكاة التجربة المقابلة.
إذا كانت محاكاة كل مكون من بروتوكول التجربة المستهدفة ممكنة باستخدام مصدر البيانات الذي يتم النظر فيه، يجب على الباحثين النظر في تسجيل بروتوكول الدراسة في هذه المرحلة قبل المضي قدمًا في تقييم الدقة المتوقعة والتقييمات التشخيصية (الخطوة 3). بديل تسجيل البروتوكول هو نشر بروتوكول التجربة المستهدفة مع الشيفرة الحاسوبية المشروحة مع جعل البيانات متاحة للباحثين المهتمين كلما كان ذلك ممكنًا. يمكن أن يكون التسجيل المسبق للبروتوكولات واتفاقيات مشاركة البيانات رادعًا لتعدين البيانات، وهو مصدر قلق شائع مع تحليلات بيانات الرعاية الصحية.
بالنسبة لدراسة الحالة المثال، تم اعتبار الديموغرافيات (العمر، الجنس، العرق، علامات الحالة الاجتماعية والاقتصادية)؛ المتغيرات المتعلقة بشدة مرض السكري بما في ذلك المضاعفات الدقيقة والكبيرة؛ التدابير المتعلقة بالتحكم في مرض السكري مثل , الحالات المصاحبة، العلاجات المشتركة، علامات السلوك الصحي، واستخدام الرعاية الصحية عوامل مربكة نظرًا لارتباطها المحتمل باختيار العلاج ومخاطر النتائج. نصف محاكاة كل مكون من بروتوكول التجربة المستهدفة من خلال تقديم وصف دقيق لعمليات تعريف المتغيرات، بما في ذلك جميع الرموز والخوارزميات، باستخدام نموذج HARPER (الملحق الشبكي 2). بالنسبة للتحليل الإحصائي، قدرنا نسبة المخاطر (المتوسطة على فترة المتابعة) عبر نموذج كوكس المعدل للتداخل الأساسي مع تصنيف ووزن درجة الميل، كما في الدراسات السابقة ذات معدل بدء علاج منخفض ونتائج أمان نادرة. قد تكون هناك حاجة إلى طرق تعديل أخرى، مثل صيغة g البارامترية أو وزن الاحتمالية العكسية، عند محاكاة التجارب مع استراتيجيات علاج مستدامة وبالتالي مع علاجات متغيرة مع الزمن. كما حددنا التحليلات في مجموعات مصنفة حسب الجنس، والعمر، وعوامل الخطر الأساسية للعدوى كتحليلات فرعية ذات أهمية لتقييم إمكانية تعديل قياس التأثير بواسطة هذه الخصائص.
تجيب الشكل 1 من الملحق على الأسئلة 1-4 لتوفير وضوح حول البيانات المحتملة الملائمة للغرض لدراسة الحالة لدينا. باختصار، يتم التقاط النتيجة والعلاج بشكل جيد في مطالبات Medicare؛ ومع ذلك، قد يكون الربط بالسجلات الصحية الإلكترونية مهمًا لتحديد العوامل السريرية التي تُستخدم كمعايير أهلية
أو عوامل مربكة. في هذه الحالة المثال، استخدمنا بيانات مطالبات Medicare Fee For Service من الأجزاء A و B، التي تم ربطها بشكل حتمي بواسطة أرقام مطالبات التأمين الصحي، وتاريخ الميلاد، والجنس (معدل نجاح الربط ) بالسجلات الصحية الإلكترونية من نظام الرعاية الصحية Mass General Brigham في بوسطن.

الخطوة 3: تقييم الدقة المتوقعة وإجراء التقييمات التشخيصية

بعد تحديد جميع خيارات التصميم بوضوح وتسجيل بروتوكول الدراسة، فإن المكون المهم التالي في التصميم هو تجميع سكان الدراسة باستخدام جميع معايير الأهلية لتقييم الدقة المتوقعة وإجراء التقييمات التشخيصية. يمكن أن تسمح هذه التقييمات بتعديلات دراسية مبدئية، ومع ذلك، لا توجد إرشادات رسمية كثيرة بشأن هذا النشاط. نملأ هذه الفجوة من خلال توضيح نهج منهجي في الشكل 3.
  • الخطوة 3أ: تقييم الدقة المتوقعة
بالنسبة للإشارات الأمنية الناشئة حيث من المحتمل أن لا يكون حجم التأثير معروفًا، يجب أن يعتمد القرار بالمضي قدمًا في التحليلات على أهمية المعلومات المكتسبة من منظور الصحة العامة. ومع ذلك، خلال مرحلة التخطيط، قد يكون من المفيد قياس الدقة المتوقعة بناءً على مصدر البيانات المختار وخيارات التصميم لتحديد ما إذا كانت التعديلات مطلوبة لتحقيق المستوى المطلوب من الدقة.
استنادًا إلى عدد النتائج وأحجام مجموعتي العلاج، يمكن للباحثين تقدير تباين نسبة المخاطر اللوغاريتمية باستخدام صيغ معروفة جيدًا وافتراضات حول حجم نسبة المخاطر. نحن نقدم دالة لتقدير الدقة المتوقعة بناءً على أحجام مجموعتي العلاج وعدد النتائج المجمعة عبر المجموعتين كمادة إضافية (ملحق ويب 3).
  • الخطوة 3ب: التقييمات التشخيصية
التقييمات التشخيصية هي مكونات رئيسية للدراسات غير التدخلية لأنها يمكن أن تنبه الباحثين إلى انتهاكات محتملة للافتراضات الأساسية للاستدلال السببي. على سبيل المثال، يعد فحص توزيع الخصائص الأساسية في مجموعات العلاج التي يتم مقارنتها تشخيصًا مهمًا لاكتشاف انتهاكات الإيجابية. يمكن أن يؤدي تقييم متوسط طول الوقت الذي يلتزم فيه المرضى باستراتيجيات العلاج المعينة وفحص خصائص المرضى الذين ينحرفون عن استراتيجيات العلاج إلى تنبيه الباحثين إلى إمكانية وجود قمع معلوماتي، مما قد يهدد قابلية التبادل. قد تكون هناك أيضًا معايير تشخيصية محددة للتحليل مفيدة. على سبيل المثال، عند استخدام تحليلات تعتمد على درجات الميل، فإن تقييم توازن المتغيرات الأساسية بعد
الشكل 3 | تقييم الدقة المتوقعة وإجراء التقييمات التشخيصية (الخطوة 3 من دليل العملية للدراسات الاستدلالية باستخدام بيانات الرعاية الصحية من الممارسة السريرية الروتينية). PS=درجة الميل
الشرط على درجة الميل يمكن أن يعمل كتشخيص لعدم تحديد النموذج. إذا تم استخدام وزن الاحتمالية العكسية للتكيف مع القمع المعلوماتي أو الارتباك المتغير مع الزمن، فإن تقييم توزيع الأوزان على مر الزمن يمكن أن يعمل كتشخيص لعدم تحديد نموذج الوزن. بالنسبة للتشخيصات المحددة للتحليل، قد يؤدي تحسين خيارات النمذجة إلى حل المشكلات.
إذا أشار التقييم إلى دقة أقل من المرغوب أو أشارت التقييمات التشخيصية إلى انتهاكات للافتراضات الأساسية للاستدلال السببي التي لا يمكن حلها عن طريق تحسين خيارات النمذجة، يمكن للمحققين النظر في العودة إلى الخطوة 2 وتغيير بعض خيارات التصميم، مثل معايير الأهلية أو اختيار مجموعة المقارنة، قبل المضي قدمًا. هذه الاقتراحات تشبه تعديل بروتوكول الدراسة الذي هو شائع في التجارب العشوائية المستقبلية استجابة لعوامل خارجية مثل تحديات التوظيف. على غرار الإرشادات المتعلقة بتعديلات البروتوكول للتجارب المستقبلية، يجب توثيق أسباب التغييرات في بروتوكول الدراسات غير التدخلية التي تستخدم بيانات الرعاية الصحية الثانوية بوضوح، بالإضافة إلى أي تغييرات في التباينات السببية التي تنتج عن تغييرات البروتوكول. للحفاظ على تعمية المحلل فيما يتعلق بارتباط العلاج والنتيجة وسلامة الدراسة، يجب على الباحثين أيضًا التأكد من عدم إدخال تعديلات البروتوكول استجابةً للتحليل الاستدلالي (الخطوة 5).
بالنسبة لمثالنا في الخطوة 3أ، كان نطاق الثقة المتوقع 95% تحت تأثير افتراضي مفترض على المقياس النسبي (1.0) لمثبطات SGLT-2 على خطر العدوى التناسلية من 0.35 إلى 1.65. هذه النتيجة غير دقيقة لأن 1498 مريضًا فقط مع 40 نتيجة كانوا مؤهلين للتحليل. نظرًا لأن حجم العينة المنخفض يرجع جزئيًا إلى معيار الإدراج لـ نتائج الاختبار قبل بدء العلاج الدوائي (الشكل الملحق 2)، يمكننا العودة إلى الخطوة 2 والنظر في تخفيف هذا المعيار، مما سيزيد من عدد الأفراد المؤهلين إلى 9339 (293 حدثًا) مع نطاق ثقة 95% من 0.73 إلى 1.27. ومع ذلك، فإن تخفيف هذا المعيار يفترض أن عدم التكيف مع في التحليل الرئيسي لا يقدم انحيازًا كبيرًا. يوفر الجدول الملحق 1 جدول تجربة مستهدفة منقح يبرز تغيير البروتوكول الوحيد الذي تم تحفيزه من خلال تقييم الدقة المتوقعة.
بالنسبة للخطوة 3ب، استخدمنا هذه المجموعة من 9339 مريضًا يستوفون معايير الأهلية وفقًا للبروتوكول المعدل. قدرنا احتمال بدء مثبطات SGLT-2 مقابل مثبطات DPP-4 (ديبيبتيديل بيبتيداز-4) نظرًا لخصائص المرضى الأساسية (أي، درجة الميل) باستخدام نماذج الانحدار اللوجستي المتعددة المتغيرات، وأنشأنا 50 طبقة بناءً على توزيع درجات الميل في المرضى الذين يتلقون علاج مثبطات SGLT-2، وقمنا بوزن بدء مثبطات DPP-4 بشكل متناسب مع توزيع بدء مثبطات SGLT-2 في طبقة درجة الميل التي وقعوا فيها. كتشخيصات لنماذج درجات الميل،
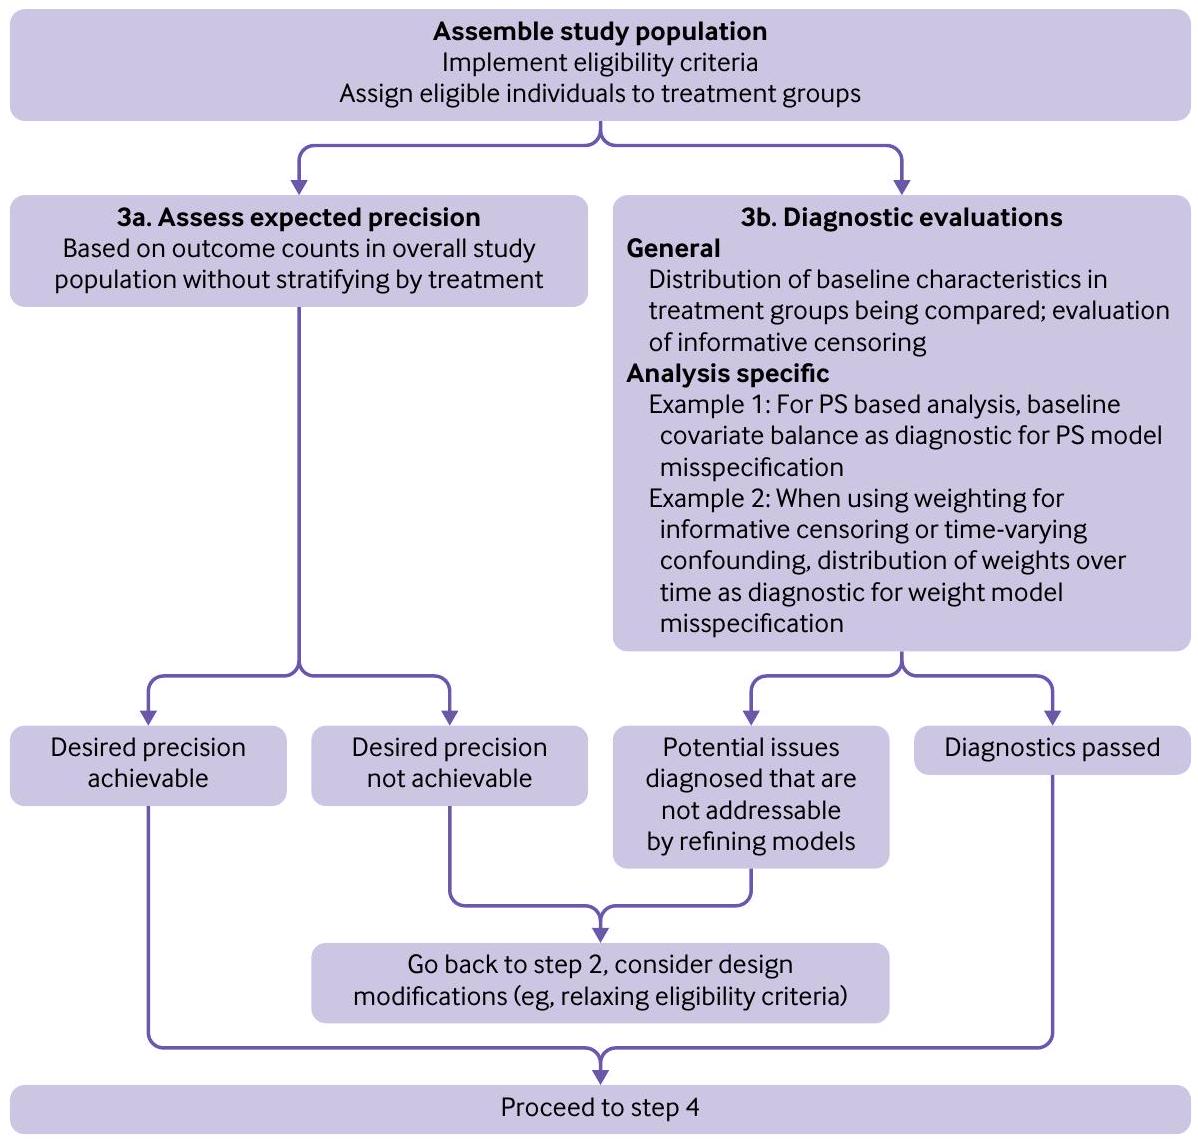
قمنا بتقييم تداخل التوزيع (الشكل الملحق 3)، توزيع الوزن (الشكل الملحق 4)، وتوازن المتغيرات باستخدام الفروق المعيارية بعد الوزن (الجداول الملحقة 2 و3). تتوفر ماكرو SAS المستخدمة لإجراء التحليل وتوليد الأشكال التشخيصية للجمهور. تم نشر جميع أكواد SAS أيضًا علىhttps://dev.sentinelsystem.org/projects/IC/repos/ic_ci2_principled/browse.

الخطوة 4: تطوير خطة لتقييمات القوة بما في ذلك تحليلات الحساسية الحتمية، وتحليلات الحساسية الاحتمالية، وتقييم الانحياز الصافي

تتعامل تقييمات القوة مع اتساق الأدلة فيما يتعلق بقرارات المحقق البديلة المتعلقة بتصميم الدراسة أو القياس أو التحليل. كخطوة رابعة وأخيرة من تخطيط الدراسة، نقترح تحديد مسبق لتقييمات القوة. بعد تقييم الدقة والتقييمات التشخيصية، ربما يكون لدى المحققين فهم إضافي للتهديدات المحتملة للدراسة ويمكنهم اتخاذ أحكام مستنيرة تتعلق بالحاجة إلى تقييمات قوة محددة. تكون هذه التقييمات المحددة مسبقًا أكثر فائدة إذا كان لديها مبرر واضح بشأن أنواع الانحياز المحددة التي تتناولها. يمكن تصنيف تقييمات القوة بشكل عام إلى ثلاثة أنواع، والتي يتم تفصيلها أدناه (الشكل 4).
  • الخطوة 4أ: تحليلات الحساسية الحتمية
يمكن اعتبار تحليلات الحساسية الحتمية، المعروفة أيضًا بتحليل الانحياز الكمي الحتمي، كتنويعات من بروتوكول التجربة المستهدفة، حيث يركز المحققون على افتراضات تصميم أو تحليل محددة ويقومون بتغييرها بشكل فردي لقياس تأثير افتراضات أو خيارات تصميم محددة على نتائج الدراسة. يمكن أن تركز تحليلات الحساسية الحتمية على خيارات تصميم أو قياس محددة للغاية، مثل تغيير تعريف النتيجة لزيادة الخصوصية وتقييم إمكانية الانحياز بسبب تصنيف خاطئ للنتيجة. يمكن أن تشمل أيضًا تحديد مسبق لطرق التحليل الإحصائي البديلة.
  • الخطوة 4ب: تحليلات الحساسية الاحتمالية
تستخدم تحليلات الحساسية الاحتمالية، المعروفة أيضًا بتحليل الانحياز الكمي الاحتمالي، أساليب احتمالية ومحاكاة مختلفة لتقييم تأثير الانحيازات الخفية المختلفة على نتائج الدراسة، بما في ذلك تصنيف خاطئ للتعرض/النتيجة، وارتباكات غير مقاسة، وانحياز الاختيار. تتطلب محاكاة مونت كارلو التي تقيم الانحياز المحتمل نطاقات واقعية لمتغيرات الانحياز، على سبيل المثال، حساسية وخصوصية خوارزمية تحديد النتيجة بناءً على المعلومات الموجودة مثل دراسات التحقق. في تلك المحاكاة، يتم إعادة حساب نتائج الدراسة لكل تشغيل ثم يتم جدولتها لتوفير تقديرات تجريبية للتغير المتوقع بسبب عدم اليقين في التعرض أو
الشكل 4 | تقييمات القوة (الخطوة 4 من دليل العملية للدراسات الاستدلالية باستخدام بيانات الرعاية الصحية من الممارسة السريرية الروتينية)
تحديد النتيجة. تتوفر أساليب نمذجة الانحياز المماثلة لتقييم تأثير الارتباكات غير المقاسة على نتائج الدراسة بناءً على قوة الارتباط بين التعرض والارتباك المشتبه به وكذلك النتيجة والارتباك المشتبه به.
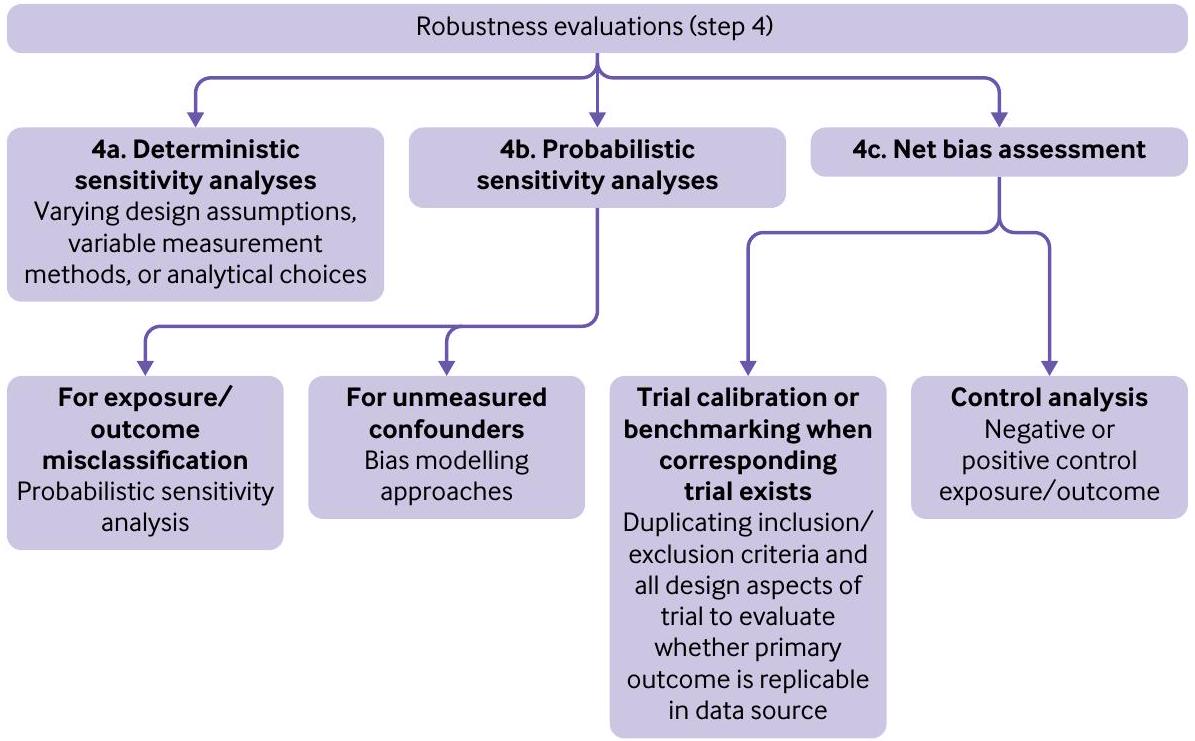
  • الخطوة 4ج: تقييم الانحياز الصافي
نستخدم مصطلح “تقييم التحيز الصافي” لوصف الأساليب التي تسمح للمحققين بالكشف عن وجود التحيز من مصادر متعددة مثل التداخل غير المنضبط، وتحامل الاختيار، وخطأ القياس. نصف نوعين رئيسيين من هذه التقييمات.
أولاً، حيثما كان ذلك ممكنًا، يجب على المحققين تحديد النتائج الضابطة أو التعرضات الضابطة المعروفة بعدم وجود ارتباطات (ضوابط سلبية) أو ارتباطات مثبتة جيدًا (ضوابط إيجابية) مع التعرض أو النتيجة المعنية. من الناحية المثالية، يجب أن تحتوي هذه المتغيرات الضابطة على هيكل تداخلي أو آلية لخطأ القياس مشابهة للتأثير المستهدف للدراسة. قد تنبه عدم القدرة على تكرار أحجام التأثير المعروفة في هذه التحليلات المحققين إلى وجود تحيز.
ثانيًا، عندما يوجد تجربة عشوائية جيدة التنفيذ للمقارنة قيد التحقيق مع نقطة نهاية أولية مختلفة أو أجريت ضمن مجموعة سكانية أكثر تقييدًا، قد يتم السعي إلى المعايرة أو ضبط التجربة. إذا كان المحققون قادرين على تكرار النتائج للنتيجة الأولية لمثل هذه التجربة في مصدر بياناتهم باستخدام معايير إدراج واستبعاد متطابقة وعناصر تصميم أخرى، فقد يزيد ذلك من الثقة في النتائج بموجب بروتوكول تجربة مستهدف معدل.
نوصي بأن يضيف المحققون تقييم دقة متوقع وتقييمات تشخيصية
بالإضافة إلى تقييمات القوة المحددة مسبقًا كإضافات للبروتوكول المسجل قبل الانتقال إلى الخطوة 5. إذا أدى تقييم الدقة المتوقعة والتقييمات التشخيصية، التي لا تسمح صراحة بأي تحليلات استنتاجية، إلى أي تعديلات ذات مغزى في التصميم أو القياس، يجب توثيق جميع هذه التغييرات أيضًا كإضافات للبروتوكول المسجل قبل بدء التحليلات الاستنتاجية.
في مثالنا، حددنا تحليل حساسية حتمي (الخطوة 4أ) لتقييم تأثير تصنيف النتائج بشكل خاطئ. عرفنا النتيجة بعد استبعاد الرموز غير المحددة للبيلانيتس والبيلانوبوستيتس في المرضى الذكور والفاجينيتس والفولفوفاجينيتس في المرضى الإناث والتركيز فقط على الكانديدا في المواقع التناسلية.
كما حددنا تحليل تحيز كمي (الخطوة 4ب). لاستكشاف تأثير افتراضنا أن ليس متداخلاً مهمًا، استخدمنا بيانات في مجموعة فرعية من المرضى لإبلاغ هذا التحليل. تم استخدام معلومات حول توزيع في مجموعتنا المرتبطة والارتباط بين المتداخل غير المقاس والنتيجة (العدوى) بناءً على الأبحاث الوبائية السابقة كمدخلات لحساب التقديرات المعدلة عبر مجموعة من معلمات التحيز.
أخيرًا، حددنا تحليل التحيز الصافي (الخطوة 4ج)، من خلال تقييم دخول المستشفى بسبب فشل القلب كنتيجة ضابطة إيجابية. لقد ثبت أن مثبطات SGLT-2 لها ارتباط مثبت مع انخفاض خطر دخول المستشفى بسبب فشل القلب. لقد لوحظ هذا الارتباط باستمرار عبر التجارب العشوائية المحكمة بما في ذلك CANVAS وCREDENCE وDAPA-HF وDECLARE-TIMI-58 وEMPAREG OUTCOME وEMPERORREDUCED وVERTIS-CV. إذا كانت مجموعة المتغيرات الضابطة كافية للتحكم في التداخل (دون إدخال تحيز) لكلا النتيجتين (عدوى الأعضاء التناسلية ودخول المستشفى بسبب فشل القلب)، فإن
متغير الأحداث/سنوات الشخص
مثبطات SGLT-2 DPP-4 نسبة المخاطر (95% CI) نسبة المخاطر (95% CI)
التحليل الأساسي
المجموعة الكاملة 123/1553 170/5785 2.68 (1.86 إلى 3.86)
الجنس الذكري 41/912 54/2781 2.32 (1.21 إلى 4.46)
الجنس الأنثوي 82/620 134/3055 3.00 (2.08 إلى 4.32)
العمر <75 سنة 77/1026 77/2755 2.69 (1.84 إلى 3.93)
العمر سنوات 44/500 81/3068 3.32 (2.04 إلى 5.41)
مع تاريخ من عوامل خطر العدوى 67/655 80/2821 3.60 (2.48 إلى 5.23)
بدون تاريخ من عوامل خطر العدوى 56/886 90/2910 2.04 (1.07 إلى 3.91)
تقييمات القوة
تحليل الحساسية: تعريف أكثر تحديدًا للنتيجة 47/1596 68/5826 2.51 (1.54 إلى 4.11)
QBA: تصحيح للمتغير غير المقاس 2.63 (1.82 إلى 3.78)
نتيجة الضبط الإيجابي: دخول المستشفى بسبب فشل القلب 23/1612 149/5785 0.55 (0.34 إلى 0.91)
0.5 1 4 8
الشكل 5 | نتائج من التحليل الأساسي، وتحليلات المجموعات الفرعية، وتقييمات القوة لدراسة المثال التي تقيم تأثير مثبطات ناقل الجلوكوز والصوديوم-2 (SGLT-2) على العدوى التناسلية. يقدم تحليل التحيز الكمي (QBA) نتائج معدلة عند قيم معلمات التحيز الملاحظة في البيانات المساعدة ( فرط سكر الدم غير المنضبط كما هو محدد بواسطة الهيموغلوبين الغليكوزيلاتي ( ) في مجموعة المرجع ونسبة الأرجحية 1.3 لتلقي علاج مثبط SGLT-2). الشكل التوضيحي 5 يقدم نتائج من هذا التحليل الكمي للانحياز عبر مجموعات مختلفة من معلمات التحيز
يمكن أن يوفر وجود ارتباط معدّل قوي بين التعرض ونتيجة الضبط الإيجابية المعروفة بعض الطمأنينة في النتائج الملاحظة لنتيجة العدوى التناسلية.

الخطوة 5: التحليل الاستنتاجي

في نهاية الخطوة 4، يتم تحديد جميع عناصر التصميم الرئيسية، والقياسات، وخطة تحليل البيانات مسبقًا، ويمكن أن يتقدم التحليل الاستنتاجي للبيانات. الفكرة المركزية وراء هيكلة الخطوات في هذه التسلسل مع تمييز واضح بين التخطيط والاستنتاج هي تجنب تغييرات التصميم أو التحليل التي تحفزها نتائج الدراسة. في ختام التحليل الاستنتاجي وجميع تقييمات القوة المحددة مسبقًا، يكون المحققون في وضع جيد لإجراء استنتاجات سليمة حول الارتباط قيد التحقيق.
في دراسة مثالنا، تم تقديم النتائج في الشكل 5، الذي أظهر خطرًا مرتفعًا باستمرار للعدوى التناسلية بعد بدء مثبطات SGLT-2 مقابل مثبطات DPP-4 في المرضى المصابين بالسكري عبر جميع المجموعات الفرعية وجميع تقييمات القوة. يلخص الشكل التوضيحي 5 تحليل التحيز الكمي للتداخل غير المنضبط بواسطة عبر مجموعة من معلمات التحيز، والتي أشارت إلى أن خطر العدوى التناسلية مع مثبطات SGLT-2 ظل مرتفعًا حتى في السيناريوهات القصوى للتداخل غير المنضبط. في تحليل التحيز الصافي، لاحظنا انخفاضًا قويًا في خطر نتيجة الضبط الإيجابية (دخول المستشفى بسبب فشل القلب)، وهو ما كان متوقعًا. بشكل عام، تشير النتائج التي تشير إلى خطر أكبر محتمل للعدوى التناسلية مع مثبطات SGLT-2 إلى توافقها مع الملاحظات السابقة من التجارب والدراسات الملاحظة. في تحليل ميتا كبير لثماني تجارب عشوائية من المرحلة 3، تم الإبلاغ عن الخطر النسبي المجمّع للعدوى التناسلية ليكون 3.75 ( فترة الثقة 3.00 إلى 4.67). تحليل سابق
لمطالبات التأمين التجاري الأمريكية أبلغ عن زيادة خطر العدوى التناسلية بمقدار ثلاثة أضعاف مع مثبطات SGLT-2 مقابل مثبطات DPP-4.

الاستنتاج

يقدم هذا التقرير عملية خطوة بخطوة تأخذ بعين الاعتبار بشكل منهجي نقاط القرار الرئيسية لتقييم التأثيرات السببية للعلاجات باستخدام بيانات الرعاية الصحية. يمكن أن تسهل العملية الموضحة في هذا الإطار الاتصالات الشفافة بين مختلف أصحاب المصلحة وتحفز الاعتبارات النقدية لمجتمع البحث السريري.

الانتماءات المؤلفين

قسم علم الأوبئة الدوائية والاقتصاد الدوائي، قسم الطب، مستشفى بريغهام والنساء، كلية هارفارد الطبية، بوسطن، MA 02120، الولايات المتحدة الأمريكية
معهد كايزر بيرماننت واشنطن للبحوث الصحية، سياتل، WA، الولايات المتحدة الأمريكية
قسم الإحصاء الحيوي، جامعة ميتشيغان، آن آربر، MI، الولايات المتحدة الأمريكية
قسم الطب السكاني، كلية هارفارد الطبية ومعهد هارفارد للرعاية الصحية، بوسطن، MA، الولايات المتحدة الأمريكية
إدارة الغذاء والدواء الأمريكية، سيلفر سبرينغ، MD، الولايات المتحدة الأمريكية
قسم الطب، كلية الطب بجامعة جونز هوبكنز، بالتيمور، MD، الولايات المتحدة الأمريكية
أقسام علم الأوبئة والإحصاء الحيوي، والطب، جامعة مكغيل، مونتريال، QC، كندا
كلية الصحة العامة بجامعة بوسطن، بوسطن، MA، الولايات المتحدة الأمريكية
قسم علم الأوبئة وقسم الإحصاءات، جامعة كاليفورنيا، لوس أنجلوس، CA، الولايات المتحدة الأمريكية
CAUSALab وأقسام علم الأوبئة والإحصاء الحيوي، كلية هارفارد TH تشان للصحة العامة، بوسطن، MA، الولايات المتحدة الأمريكية
قسم الإحصاء الحيوي، جامعة واشنطن، سياتل، WA، الولايات المتحدة الأمريكية
المساهمون: RJD و SVW و ST و JCN و SS و SD و RB و GDP لديهم أدوار قيادية في مبادرة Sentinel التابعة لإدارة الغذاء والدواء، وهي النظام الوطني للمراقبة النشطة بعد التسويق للمنتجات الطبية في الولايات المتحدة. جميع المؤلفين الآخرين هم خبراء مدعوون من الأوساط الأكاديمية أو إدارة الغذاء والدواء ولديهم سنوات عديدة من الخبرة المشتركة في تطوير الأساليب التي تُعلم إجراء الدراسات غير التدخلية. المؤلفون المشاركون من
شاركت إدارة الغذاء والدواء الأمريكية (FDA) في تفسير النتائج وفي إعداد القرار لتقديم المخطوطة للنشر. تم جمع المؤلفين معًا كفريق عمل مدعوم من مركز الابتكار Sentinel التابع لـ FDA. عقد فريق العمل 12 مكالمة عبر الهاتف بين يونيو 2021 وديسمبر 2022، حضرها المؤلفون (RJD، SVW، SKS، LZ، FK-K، JCN، XS، ST، RW، EP، SD، JL، HL، RB، GDP، JBS، SS، KJR، SG، MAH، PJH، وSS) لمناقشة العملية والوصول إلى توافق. قام RJD وSKS وLZ وFKK بإجراء تحليل البيانات لدراسة الحالة. RJD هو الضامن لمحتوى هذه المقالة. يؤكد المؤلف المراسل أن جميع المؤلفين المدرجين يستوفون معايير التأليف وأنه لم يتم استبعاد أي شخص آخر يستوفي المعايير.
التمويل: تم دعم هذا المشروع من خلال الاتفاقية الرئيسية 75F40119D10037 من إدارة الغذاء والدواء الأمريكية (FDA). وافقت إدارة الغذاء والدواء على بروتوكول الدراسة المستخدم في المثال التوضيحي الموضح في الملحق الإلكتروني 2، بما في ذلك خطة التحليل الإحصائي، وراجعت ووافقت على هذه المخطوطة. لم يكن لإدارة الغذاء والدواء أي دور في جمع البيانات أو إدارتها أو تحليلها. الآراء المعبر عنها هي آراء المؤلفين وليست بالضرورة آراء إدارة الغذاء والدواء.
المصالح المت competing: جميع المؤلفين قد أكملوا نموذج الإفصاح الموحد ICMJE فيwww.icmje.org/disclosure-of-interest/ويعلن: دعم من إدارة الغذاء والدواء للعمل المقدم. يذكر RJD أنه يعمل كمدير رئيسي للمشاريع البحثية الممولة من مستشفى بريغهام والنساء من نوفارتس وفيرتيكس وباير في مشاريع غير ذات صلة. SS هو مدير مشارك لمشروع بحثي ممول من مستشفى بريغهام والنساء من بوهرينجر إنجلهايم غير مرتبط بموضوع هذه الدراسة، وهو مستشار لشركة Aetion، وهي شركة تصنيع برمجيات يمتلك أسهمًا فيها؛ وقد تم إعلان اهتماماته ومراجعتها والموافقة عليها من قبل مستشفى بريغهام والنساء ونظام ماس جنرال بريغهام للرعاية الصحية وفقًا لسياسات الامتثال المؤسسية الخاصة بهم. RB هو مؤلف في براءة اختراع أمريكية رقم 9075796 (في استخراج النصوص من مجموعات البيانات الطبية الكبيرة وتصنيف النصوص الطبية المقابلة باستخدام اختيار الميزات المفيدة)، والتي في الوقت الحالي ليست مرخصة ولا تولد إيرادات. يذكر JCN تمويلًا بحثيًا من موديرنا مقابل خدمته في لجنة مراقبة السلامة الخاصة بهم.
الأصل ومراجعة الأقران: لم يتم تكليفه؛ تمت مراجعته من قبل أقران خارجيين.
1 كونكاتو ج، كورغان-كوراى ج. الأدلة من العالم الحقيقي – أين نحن الآن؟ نيو إنجلاند / ميد 2022؛ 386:1680-2. doi:10.1056/ NEJMp2200089
إدارة الغذاء والدواء. أفضل الممارسات لإجراء وتقرير دراسات السلامة الدوائية باستخدام مجموعات بيانات الرعاية الصحية الإلكترونية. 2013.https://www.fda.gov/regulatory-information/search-fda-guidance-documents/best-practices-conducting-and-reporting-pharmacoepidemiologic-safety-studies-using-electronic.
3 الشبكة الأوروبية لمراكز علم الأوبئة الدوائية واليقظة الدوائية. دليل ENCePP للمعايير المنهجية في علم الأوبئة الدوائية. 2022https://www.encepp.eu/standards_ و_الإرشادات/الدليل_المنهجي.shtml.
4 نجوم نعم، هيرنان MA، ريفز BC، وآخرون. ROBINS-I: أداة لتقييم خطر التحيز في الدراسات غير العشوائية للتدخلات. BMJ 2016؛ 355: i4919. doi:10.1136/bmj.i4919
5 دريير ن.أ، براينت أ، فيلنتغاس ب. قائمة فحص GRACE: أداة تقييم موثوقة لدراسات الملاحظة عالية الجودة حول الفعالية المقارنة. مجلة إدارة الرعاية والصيدلة المتخصصة 2016؛ 22: 1107-13. doi:10.18553/jmcp.2016.22.10.1107
6 لانغان إس إم، شميت إس إيه، وينغ ك، وآخرون. بيان تقارير الدراسات التي أجريت باستخدام بيانات الصحة المجمعة بشكل روتيني لأغراض علم الأوبئة الدوائية (RECORD-PE). BMJ 2018؛ 363: k3532. doi:10.1136/bmj.k3532
7 وانغ إس في، بينهيرو إس، هوا و، وآخرون. STaRT-RWE: قالب منظم للتخطيط والإبلاغ عن تنفيذ دراسات الأدلة الواقعية. BMJ 2021;372:m4856. doi:10.1136/bmj.m4856
8 وانغ إس في، بوتيغارد أ، كراون و، وآخرون. نموذج بروتوكول موحد لتعزيز قابلية إعادة إنتاج الدراسات التي تقيم فرضيات الأدلة الواقعية حول آثار العلاج: تقرير ممارسات جيدة من مجموعة عمل مشتركة بين ISPE/ISPOR. قيمة الصحة 2022؛ 25: 1663-72. doi:10.1016/j.jval.2022.09.001
9 برجر ML، سوكس H، ويلكي RJ، وآخرون. ممارسات جيدة لدراسات البيانات الواقعية حول العلاج و/أو الفعالية المقارنة: توصيات من فريق العمل الخاص المشترك ISPOR-ISPE حول الأدلة الواقعية في اتخاذ قرارات الرعاية الصحية. Pharmacoepidemiol Drug Saf 2017؛ 26: 1033-9. doi:10.1002/pds.4297
10 أورسيني إل إس، بيرجر م، كراون و، وآخرون. تحسين الشفافية لبناء الثقة في دراسات البيانات الثانوية الواقعية لاختبار الفرضيات – لماذا، ماذا، وكيف: توصيات وخارطة طريق من مبادرة شفافية الأدلة الواقعية. قيمة الصحة 2020؛ 23: 1128-36. doi:10.1016/j.jval.2020.04.002
11 شومي MJ، رايان PB، برات N، وآخرون. مبادئ توليد وتقييم الأدلة على نطاق واسع عبر شبكة من قواعد البيانات (LEGEND). / جمعية المعلومات الطبية الأمريكية 2020؛27:1331-7. doi:10.1093/jamia/ocaa103
12 دانغ إل إي، غروبر إس، لي إتش، وآخرون. خارطة طريق سببية لتوليد أدلة عالية الجودة من العالم الحقيقي. مجلة العلوم السريرية والترجمة 2023؛7:e212. doi:10.1017/cts.2023.635
13 Ball R، Robb M، Anderson SA، Dal Pan G. مبادرة السنتينل التابعة لإدارة الغذاء والدواء – نهج شامل لمراقبة المنتجات الطبية. Clin Pharmacol Ther 2016;99:265-8. doi:10.1002/cpt.320
14 إدارة الغذاء والدواء. تحذر إدارة الغذاء والدواء من حدوث حالات نادرة لعدوى خطيرة في منطقة الأعضاء التناسلية مع مثبطات SGLT2 لمرض السكري. 2018.https://www.fda.gov/drugs/drug-safety-and-availability/fda-warns-about-rare-occurrences-serious-infection-genital-area-sglt2-inhibitors-diabetes.
15 هيرنان م. الكلمة C: التلاعب العلمي لا يحسن الاستدلال السببي من البيانات الملاحظة. مجلة الصحة العامة الأمريكية 2018؛ 108: 616-9. doi:10.2105/AJPH.2018.304337
16 E9(R1) المبادئ الإحصائية للتجارب السريرية. ملحق: التقديرات وتحليل الحساسية في التجارب السريرية. 2022.https://www.fda.gov/معلومات-تنظيمية/بحث-وثائق-إرشادية-إدارة-الغذاء-والدواء/e9r1-المبادئ-الإحصائية-التجارب-السريرية-ملحق-التقديرات-وتحليل-الحساسية-السريرية
17 هيرنان MA، روبينز JM. استخدام البيانات الكبيرة لمحاكاة تجربة مستهدفة عندما لا تكون تجربة عشوائية متاحة. أم أ Epidemiol 2016؛ 183: 75864. doi:10.1093/aje/kwv254
18 ديكرمان بي إيه، غارسيا-ألبينيز إكس، لوغان آر دبليو، دينكاساس إس، هيرنان إم إيه. محاكاة تجربة مستهدفة في تصاميم الحالات والشواهد: تطبيق على الستاتينات وسرطان القولون. المجلة الدولية لعلم الأوبئة 2020؛49:1637-46. doi:10.1093/ije/dyaa144
19 هيرنان MA، هيرنانديز-دياز S، ويرلر MM، ميتشل AA. المعرفة السببية كشرط مسبق لتقييم التداخل: تطبيق على وبائيات عيوب الولادة. أم / وبائيات 2002؛ 155: 176-84. doi:10.1093/aje/155.2.176
20 تينانت PWG، موري EJ، أرنولد KF، وآخرون. استخدام الرسوم البيانية الموجهة غير الدائرية (DAGs) لتحديد العوامل المربكة في أبحاث الصحة التطبيقية: مراجعة وتوصيات. المجلة الدولية لعلم الأوبئة 2021؛50:620-32. doi:10.1093/ije/dyaa213
21 فاندرويل تي جي. مبادئ اختيار العوامل المربكة. المجلة الأوروبية لعلم الأوبئة 2019;34:211-9. doi:10.1007/s10654-019-00494-6
22 شنيوايس س، راسين JA، براون JS، وآخرون. التصوير البياني لتصاميم الدراسات الطولية في قواعد بيانات الرعاية الصحية. آن إنترن ميد 2019؛ 170: 398-406. doi:10.7326/M18-3079
إدارة الغذاء والدواء. مبادرة سينتينل. 2022.https://www. sentinelinitiative.org/about/key-database-statistics
24 ديساي RJ، ماثيني ME، جونسون K، وآخرون. توسيع نطاق نظام FDA Sentinel: خارطة طريق لدمج بيانات السجلات الصحية الإلكترونية في إطار تحليل سببي. NPJ Digit Med 2021؛ 4:170. doi:10.1038/s41746-021-00542-0
25 إدارة الغذاء والدواء. البيانات الواقعية: تقييم السجلات الصحية الإلكترونية وبيانات المطالبات الطبية لدعم اتخاذ القرارات التنظيمية للمنتجات الدوائية والبيولوجية. إرشادات للصناعة. 2021.fda.gov/regulatory-information/search-fda-guidance-documents/real-world-data-assessing-electronic-health-records-and-medical-claims-data-support-regulatory.
26 ديساي RJ، لين KJ، باتورنو E، وآخرون. تطوير والتحقق الأولي من نموذج قائم على مطالبات ميديكير للتنبؤ بفئة كسر قذف البطين الأيسر لدى المرضى الذين يعانون من فشل القلب. Circ Cardiovasc Qual Outcomes 2018;11:e004700. doi:10.1161/CIRCOUTCOMES.118.004700
27 بهات AS، فادوجاناتان M، زهو M، فو EL، سولومون SD، ديساي RJ. خطر الإصابة بالفشل الكلوي الحاد بين كبار السن الذين يعانون من فشل القلب مع انخفاض الكسر القذفي المعالج بمثبطات أنجيوتنسين-نيبريلازين مقابل مثبطات نظام الرينين-أنجيوتنسين في الرعاية السريرية الروتينية. J Card Fail 2023؛ 29: 138-46. doi:10.1016/j.cardfail.2022.09.004
28 ديساي RJ، سولومون SD، فادوجاناتان M. معدلات بدء استخدام سبيرونولاكتون وعمليات الاستشفاء اللاحقة بسبب فرط بوتاسيوم الدم لدى المرضى الذين يعانون من فشل القلب مع الحفاظ على كسر القذف بعد تجربة TOPCAT: دراسة جماعية لمستفيدي ميديكير. J Card Fail 2022;28:1035-9. doi:10.1016/j.cardfail.2022.01.012
29 Wahl PM، Rodgers K، Schneeweiss S، وآخرون. التحقق من صحة رموز التشخيص والإجراءات المستندة إلى المطالبات للأحداث السلبية الخطيرة المتعلقة بالقلب والجهاز الهضمي في سكان مؤمن عليهم تجارياً. Pharmacoepidemiol Drug Saf 2010؛ 19:596-603. doi:10.1002/pds.1924
30 فلويد جي إس، بان MA، فيلشر AH، وآخرون. التحقق من صحة التهاب البنكرياس الحاد بين البالغين في نظام رعاية صحية متكامل. علم الأوبئة 2023؛34:33-37. doi:10.1097/EDE.0000000000001541
31 فيرنانديز إيه سي، دوتا آر، فيلوبيللاي إس، سانيل جي، ستيوارت آر، تشاندرا إن. تحديد أفكار الانتحار ومحاولات الانتحار في قاعدة بيانات البحث السريري النفسي باستخدام معالجة اللغة الطبيعية. ساي ريب 2018؛8:7426. doi:10.1038/s41598-018-25773-2
32 لاش تي إل، فوكس إم بي، ماكلوهوز آر إف، مالدونادو جي، مككاندلس إل سي، غرينلاند إس. ممارسات جيدة لتحليل التحيز الكمي. المجلة الدولية لعلم الأوبئة 2014؛43:1969-85. doi:10.1093/ije/dyu149
مبادرة 33 سنتينل. توسيع نظام سنتينل التابع لإدارة الغذاء والدواء الأمريكية لبيانات نقل الدم للمرضى الداخليين من شركة مستشفيات أمريكا: خيارات مراقبة جديدة. 2017.https://www. sentinelinitiative.org/sites/default/files/Sentinel-ICPE-2017-Presentation-HCA-Data-Exploration.pdf
34 كين لي، روبينز جي إم، لانو إي، لوغان آر، كوستاجليولا دي، هيرنان إم إيه. متى نبدأ العلاج؟ نهج منهجي لمقارنة الأنظمة الديناميكية باستخدام البيانات الملاحظة. المجلة الدولية للإحصاء الحيوي 2010؛6:18. doi:10.2202/1557-4679.1212
35 شني وايس س. تحليل الحساسية والتعديل الخارجي للعوامل المربكة غير المقاسة في دراسات قواعد البيانات الوبائية للعلاج. سلامة الأدوية وعلم الأوبئة 2006؛ 15: 291-303. doi:10.1002/pds.1200
36 ستورمر تي، شنيوايس إس، أفورن جي، غلين آر جي. تعديل تقديرات التأثير للخلط غير المقاس باستخدام بيانات التحقق من صحة باستخدام معايرة درجة الميل. مجلة علم الأوبئة الأمريكية 2005؛162:279-89. doi:10.1093/aje/kwi192
37 مركز عمليات الحارس. ممارسات ضمان جودة بيانات الحارس. 2017.https://www.sentinelinitiative.org/sites/default/files/data/distributed-database/Sentinel_DataQAPractices_Memo.pdf
38 سميث جي دي، إبراهيم س. استخراج البيانات، التحيز، أو التداخل، يمكن أن تؤدي جميعها إلى نشر مقالك في BMJ والصحف يوم الجمعة. BMJ 2002؛ 325: 14378. doi:10.1136/bmj.325.7378.1437
39 ديساي RJ، روثمان KJ، باتيمان BT، هيرنانديز-دياز S، هويبرختس KF. نهج تصنيف دقيق قائم على درجة الميل لضبط التداخل عندما يكون التعرض نادرًا. علم الأوبئة 2017؛ 28:24957. doi:10.1097/EDE.0000000000000595
40 ديساي RJ، فرانكلين JM. طرق بديلة لضبط التداخل في الدراسات الرصدية باستخدام الوزن بناءً على درجة الميل: مقدمة للممارسين. BMJ 2019;367:15657. doi:10.1136/bmj.l5657
41 باتورنو إي، هويبرختس ك.ف، باتيمان ب.ت، وآخرون. استخدام الليثيوم أثناء الحمل وخطر التشوهات القلبية. نيو إنجلند جورنال أوف ميديسن 2017؛ 376: 2245-54. doi:10.1056/NEJMoa1612222
42 سميث LH، غارسيا-ألبينيز X، تشان JM، وآخرون. محاكاة تجربة مستهدفة مع استراتيجيات علاج مستدامة: تطبيق على سرطان البروستاتا باستخدام كل من وزن الاحتمالات العكسية وصيغة g. يوروب) إبييديميو 2022؛37:1205-13. doi:10.1007/s10654-022-00929-7
43 هيرنان م. أ. تحليلات سببية لقاعدة البيانات الموجودة: لا حاجة لحسابات القوة. / علم الأوبئة السريرية 2022;144:203-5. doi:10.1016/j.jclinepi.2021.08.028
44 روثمان ك.ج، غرينلاند س. تخطيط حجم الدراسة بناءً على الدقة بدلاً من القوة. علم الأوبئة 2018؛29:599-603. doi:10.1097/EDE.0000000000000876
45 زو ي، هوبارد ر. أ، تشوباك ج، روي ج، ميترا ن. المفاهيم الأساسية في علم الأوبئة الدوائية: انتهاكات فرضية الإيجابية في التحليل السببي للبيانات الملاحظة: العواقب والأساليب الإحصائية. علم الأوبئة الدوائية وسلامة الأدوية 2021؛30:1471-85. doi:10.1002/pds.5338
46 ويستبر-كلارك م، ستورمر ت، وانغ ت، وآخرون. استخدام درجات الميل لتقدير آثار قرارات بدء العلاج: حالة العلم. ستات ميد 2021؛ 40: 1718-35. doi:10.1002/sim.8866
47 ويس آر، إليس إيه آر، بروكهارت م أ، وآخرون. دور نمذجة التنبؤ في تقدير درجة الميل: تقييم الانحدار اللوجستي، bCART، ودرجة الميل المتوازنة للمتغيرات. أم / وبائيات 2014؛180:645-55. doi:10.1093/aje/kwu181
48 كول SR، هيرنان MA. بناء أوزان الاحتمالات العكسية لنماذج الهيكل الهامشي. مجلة علم الأوبئة الأمريكية 2008؛168:656-64. doi:10.1093/aje/kwn164
49 شولتز ك. ف، ألتمن د. ج، موهر د. بيان CONSORT 2010: إرشادات محدثة للإبلاغ عن التجارب العشوائية ذات المجموعات المتوازية. مجلة علم الأدوية والعلاج 2010؛1:100-7. doi:10.4103/0976-500X.72352
50 أوستن بي سي. استخدام الفرق المعياري لمقارنة انتشار متغير ثنائي بين مجموعتين في البحث الملاحظ. إحصائيات التواصل والمحاكاة والحساب 2009؛ 38: 122834 doi:10.1080/03610910902859574.
51 ديساي ر. ماكرو SAS لتصنيف الدرجات الاحتمالية الدقيقة. doi:10.7910/DVN/U8JLCW. الطبعة الخامسة: Harvard Dataverse، 2020.
52 فوكس إم بي، لاش تي إل، غرينلاند إس. طريقة لأتمتة التحليلات الحساسية الاحتمالية للمتغيرات الثنائية المصنفة بشكل خاطئ. المجلة الدولية لعلم الأوبئة 2005؛34:1370-6. doi:10.1093/ije/dyi184
53 لاش تي إل، فوكس إم بي، كوني دي، لو واي، فورشي آر إيه. تحليل التحيز الكمي في الإعدادات التنظيمية. مجلة الصحة العامة الأمريكية 2016؛ 106: 122730. doi:10.2105/AJPH.2016.303199
54 أرنولد بي إف، إركومين أ، بنيامين-تشونغ ج، كولفورد ج م ج. تقرير موجز: الضوابط السلبية لاكتشاف انحياز الاختيار وانحياز القياس في الدراسات الوبائية. علم الوبائيات 2016؛ 27: 637-41. doi:10.1097/EDE.0000000000000504
55 Lipsitch M، Tchetgen Tchetgen E، Cohen T. الضوابط السلبية: أداة للكشف عن التداخل والتحيز في الدراسات الرصدية. علم الأوبئة 2010؛21:383-8. doi:10.1097/EDE.0b013e3181d61eeb
56 خسرو-خاور ف، كيم إس سي، لي إتش، لي إس بي، ديساي آر جي. توفاسيتينيب ومخاطر النتائج القلبية الوعائية: نتائج من دراسة سلامة توفاسيتينيب في مرضى الروماتويد في الرعاية الروتينية (STAR-RA). آن رومات ديس 2022؛81:798-804. doi:10.1136/ annrheumdis-2021-221915
57 ماثيوز AA، داهابره IJ، فروبيرت O، وآخرون. تقييم التحليلات الملاحظة قبل استخدامها للإجابة على الأسئلة التي لا تجيب عليها التجارب: تطبيق على سحب الجلطة التاجية. أم I إيبيديميول 2022؛ 191: 1652-65. doi:10.1093/aje/kwac098
58 فانديرز WD، خوري MJ. التقييم غير المباشر للتشويش: الوصف الرسومي والحدود على تأثير التعديل للمتغيرات المشتركة. علم الأوبئة 1990؛1:239-46. doi:10.1097/00001648-199005000-00010
59 مور أ، ديكرز أوم، نيلسن ج.س، بيك-نيلسن هـ، سورنسن هـ.ت، طومسن ر.و. تأثير التحكم في نسبة السكر في الدم على خطر العدوى لدى مرضى السكري من النوع 2: دراسة قائمة على السكان. أم أي إيبيديميول 2017؛186:227-36. doi:10.1093/aje/kwx049
60 زيلنيكر TA، ويفيوت SD، راز I، وآخرون. مثبطات SGLT2 للوقاية الأولية والثانوية من النتائج القلبية الوعائية والكلوية في داء السكري من النوع 2: مراجعة منهجية وتحليل تلوي لتجارب النتائج القلبية الوعائية. لانسيت 2019؛393:31-9. doi:10.1016/S0140-6736(18)32590-X
61 فادوجاناتان M، دوشرتي KF، كلاغيت BL، وآخرون. مثبطات SGLT-2 في المرضى الذين يعانون من فشل القلب: تحليل تلوي شامل لخمس تجارب عشوائية محكومة. لانسيت 2022؛400:757-67. doi:10.1016/S0140-6736(22)01429-5
62 تشيو M، دينغ L-L، زانغ M، زو HR. سلامة أربعة مثبطات SGLT2 في ثلاث أمراض مزمنة: تحليل تلوي لتجارب عشوائية كبيرة لمثبطات SGLT2. داء السكري وأبحاث الأمراض الوعائية 2021؛18:14791641211011016. doi:10.1177/14791641211011016
63 ديف CV، شنيوايس S، باتورنو E. المخاطر المقارنة للعدوى التناسلية المرتبطة بمثبطات ناقل الصوديوم والجلوكوز 2. داء السكري والسمنة والتمثيل الغذائي 2019؛21:434-8. doi:10.1111/dom.13531
الملحق الإلكتروني 1: أشكال وجداول الملحق الإلكتروني 2: بروتوكول الدراسة لدراسة حالة المثال الملحق الإلكتروني 3: دالة R للخطوة 3a (تقييم الدقة المتوقعة)

Process guide for inferential studies using healthcare data from routine clinical practice to evaluate causal effects of drugs (PRINCIPLED): considerations from the FDA Sentinel Innovation Center

Rishi J Desai, Shirley V Wang, Sushama Kattinakere Sreedhara, Luke Zabotka, Farzin Khosrow-Khavar, Jennifer C Nelson, Xu Shi, Sengwee Toh, Richard Wyss, Elisabetta Patorno, Sarah Dutcher, Jie Li, Hana Lee, Robert Ball, Gerald Dal Pan, Jodi B Segal, Samy Suissa, Kenneth J Rothman, Sander Greenland, Miguel A Hernán, Patrick J Heagerty, Sebastian Schneeweiss

For numbered affiliations see end of the article
Correspondence to: R J Desai rdesai@bwh.harvard.edu (or @RishiDesai11 on Twitter; ORCID 0000-0003-0299-7273)
Additional material is published online only. To view please visit the journal online.
Citethis as:BMJ2024;384:e076460
http://dx.doi.org/10.1136/
bmj-2023-076460
Accepted: 11 December 2023

Abstract

This report proposes a stepwise process covering the range of considerations to systematically consider key choices for study design and data analysis for noninterventional studies with the central objective of fostering generation of reliable and reproducible evidence. These steps include (1) formulating a well defined causal question via specification of the target trial protocol; (2) describing the emulation of each component of the target trial protocol and identifying fit-for-purpose data; (3) assessing expected precision and conducting diagnostic evaluations; (4) developing a plan for robustness assessments including deterministic sensitivity analyses, quantitative bias analyses, and net bias evaluation; and (5) inferential analyses.

SUMMARY POINTS

Non-interventional studies (also referred to as observational studies) conducted using healthcare data that are generated during provision of routine clinical care (including health insurance claims and electronic health records) provide an opportunity to fill in evidence gaps for questions not answered by randomized trials
Despite several assessment and guideline tools available to evaluate the validity of such non-interventional studies, none proposes a practical guide for the conduct and analysis of these studies
PRINCIPLED (process guide for inferential studies using healthcare data from routine clinical practice to evaluate causal effects of drugs) is a stepwise process proposed to systematically consider key choices for study design and data analysis for non-interventional studies
The process outlined here can inform the conduct of non-interventional studies, facilitate transparent communications between various stakeholders, and could motivate similar considerations for the clinical research community
Non-interventional studies, also referred to as observational studies, are conducted using real world data sources typically including healthcare data that are generated during provision of routine clinical care (including health insurance claims and electronic health records). These studies provide an opportunity to fill in evidence gaps for questions that have not been answered by randomized trials. However, generating decision grade evidence from healthcare data requires a robust causal framework to avoid introducing bias. Numerous tools aimed at improving the conduct or reporting of these non-interventional studies are available. Broad guidance documents discuss the methodology for non-interventional studies-such as the best practices for pharmacoepidemiological safety studies by the Food and Drug Administration (FDA) and the European Network of Centres for Pharmacoepidemiology and Pharmacovigilance (EncEPP) guide on methodological standards in pharmacoepidemiology. Quality assessment tools such as ROBINS-I and GRACE checklist assist with the evaluation of bias in published studies. Reporting tools such as RECORD-PE and STaRT-RWE provide checklists or structured templates to facilitate transparency in protocol reporting and reproducibility. Finally, the harmonized protocol template HARPER is supported by regulators to improve communication of key study parameters in non-interventional studies, and is deposited with protocol registration websites (eg, the Open Science Foundation’s OSF.io and European Medicines Agency’s ENcEPP.eu). While useful for their specific purposes, these tools are not explicitly intended to guide the design and conduct of non-interventional studies that evaluate drug safety and effectiveness using healthcare data.
Other frameworks such as LEGEND and the causal roadmap outline some broad general principles for evidence generation. However, they provide limited practical guidance on critical aspects of the process of evidence generation, including determining fitness-forpurpose of the data source, registering study protocols, considering principled adaptations over the course of a study, and planning robustness evaluations. To that end, we present a stepwise process covering these key choices with respect to design and analysis that can influence the validity of such studies. We initiate our discussion by considering the FDA Sentinel system, a
national, postmarketing active surveillance system for drug products using large volumes of healthcare data from insurance claims and electronic health records as a representative use case. The five step process outlined in this report covers formulating a well defined causal question via specification of the target trial protocol; describing the emulation of each component of the target trial protocol and identifying fit-for-purpose data source; assessing expected precision and conducting diagnostic evaluations; developing a plan for robustness assessments including deterministic sensitivity analyses, quantitative bias analyses, and net bias evaluation; and inferential analyses.

Overview of the proposed process guide

PRINCIPLED (process guide for inferential studies using healthcare data from routine clinical practice to evaluate causal effects of drugs) is a five step process to help ask and answer a causal question regarding drug treatment effects using healthcare data. We explicitly differentiate between a study planning phase (steps 1-4) where no inference is made, and a study analysis phase (step 5) where inferential analyses are conducted with the intent to draw causal inferences. Figure 1 shows an overview of the proposed steps. Sections below discuss each of the steps in detail. We illustrate the operationalization of each step through an example of the evaluation of sodium-glucose cotransporter-2 (SGLT-2) inhibitors, drugs used for type 2 diabetes treatment, with respect to the known safety concern of genital infections. While this process considers an iterative general approach to resolve issues as they arise during conduct of non-interventional studies, specific situations could necessitate deliberate
deviation from these steps. Even in situations where the process cannot be fully implemented, a reasonable study could still be conducted, but certain trade-offs might need to be made.

Step 1: Formulate a causal question via specification of the target trial protocol

Asking the right question in the right manner constitutes the first step in any process for causal inference about treatment effects from observed data. A practical way to ask a causal question in non-interventional studies is to specify a protocol of the target trialthe pragmatic trial that would answer the causal question. Among the key elements of the target trial protocol that need to be specified are eligibility criteria, treatment strategies, primary outcome(s) of interest, treatment assignment, start and end of the followup, and causal contrast (eg, intention-to-treat or per protocol effect). Precise specification of the target trial protocol is critical because it has direct implications in analysis and interpretation. For instance, specified eligibility criteria determine the population to which the results would apply. Table 1 summarizes the basic target trial protocol for our case example study.

Step 2: Describe the emulation of each component of the target trial protocol and identify a fit-for-purpose data source

Specifying the key components of the target trial protocol in step 1 clarifies a list of the data elements necessary to emulate it. Next, confounders that are necessary to emulate baseline randomization should be identified. Causal diagrams, such as causal directed acyclic graphs, are useful to make decisions
Fig 1 | Overview of the process guide for inferential studies using healthcare data from routine clinical practice
Table 1 | Target trial protocol for case example study evaluating the effect of sodium-glucose cotransporter-2 (SGLT-2) inhibitors on genital infections
Element Specification Emulation using real world data sources
Eligibility criteria Patients with type 2 diabetes mellitus; aged years; no use of study drug treatments before randomization; no history of end stage renal disease, HIV, or genital infections; continuous Medicare enrolment for six months and recorded glycated hemoglobin test results in electronic health records in six months before treatment initiation Same as target trial
Treatment strategies
Initiation of (1) SGLT-2 inhibitors (canagliflozin, dapagliflozin, empagliflozin); or (2) DPP-4 inhibitors (alogliptin, linagliptin, saxagliptin, sitagliptin).
Under both strategies, use of antidiabetic treatment after initiation is left to physician and patients’ discretion
Same as target trial
Treatment assignment Randomized, non-blinded Non-blinded and assumed to be randomized within levels of measured confounders*
Follow-up start (time 0) At assignment Same as target trial
Follow-up end First of administrative end of follow-up (day 365), loss to follow-up, death, or outcome occurrence Same as target trial
Primary outcome Genital infections Same as target trial
Causal contrast Intention-to-treat effect (effect of being assigned to the treatment) Observational analogue of intention-to-treat effect
SGLT-2=sodium-glucose cotransporter-2; DPP-4=dipeptidyl peptidase-4; HbA1c=glycated hemoglobin.
*Measured confounders include demographics (age, sex, race, socioeconomic status markers), diabetes severity related variables including microvascular and macrovascular complications, measures related to diabetes control such as , comorbid conditions, cotreatments, markers for healthy behavior, and healthcare use.
about confounder selection when sufficient content knowledge is available. Importantly, adjustment for colliders and instrumental variables should be avoided.
Once all data elements are outlined, investigators need to describe the emulation of each component of the target trial protocol by providing a precise description of variable definitions, including all codes and algorithms used for eligibility criteria, treatment strategies (including treatment initiation and discontinuation), outcomes, and confounders (step 2a). Data analyses that would be implemented if the data from the target trial were available should also be described in detail. Structured protocol templates such as STaRT-RWE and HARPER are available to assist with transparent reporting of the study protocol. A design diagram is suggested to summarize visually the longitudinal design aspects of a study.
Next, investigators need to identify fit-for-purpose data sources that contain all data elements needed for successful emulation of the target trial (step 2b). Target trial specification is an iterative process that depends on the availability of data to support the emulation. If certain data elements are not included in the data source being considered, investigators can consider alternate data sources.
As an example of selection of fit-for-purpose data, we consider the Sentinel system, which contains structured data from health insurance claims representing 844 million person years of observation between 2000 and 2021 across a large network of data providers, and is increasingly being enriched with insurance claims and linked data from electronic health records. Figure 2 outlines an approach to assess the fitness of purpose that is compatible with FDA draft guidance to industry on real world data. Two key considerations are data relevance and data reliability. For determination of relevance, we consider the context of Sentinel where most of the data come from insurance claims, and ancillary sources (including electronic health records) provide
opportunities for augmentation. In this case, relevance determination depends on a series of questions focused on measurement characteristics of four variable types central to the research question of interest in insurance claims data: eligibility criteria, outcome, treatment, and key confounders. If measurement of any of these variables is deemed to be insufficient, augmentation of insurance claims with alternate sources such as linked electronic health records would be needed. We describe below the specific nuances when considering these four key questions.
  • Question 1: Can the eligibility criteria be emulated with sufficient accuracy?
    Certain eligibility criteria specified in the target trial protocol (eg, some medical conditions) might not be explicitly identifiable in insurance claims and a previously validated phenotyping algorithm might not be available. In these circumstances, linkage to electronic health records will be needed for development and validation of phenotyping algorithms identifying the health conditions of interest using claims based proxy information.
    For instance, heart failure subtypes of preserved and reduced ejection fraction are not directly identifiable in insurance claims owing to lack of ejection fraction measurements. A probabilistic phenotyping algorithm based on Medicare claims for identifying ejection fraction subtypes for heart failure was developed using Medicare claims linked to electronic health records from the Mass General Brigham healthcare system. It demonstrated overall accuracy of in differentiating between preserved and reduced ejection fraction subtypes. This model facilitated deployment of this algorithm in national Medicare claims data to study drug treatment outcomes for these specific populations of interest. In circumstances where a developed algorithm demonstrates suboptimal performance, limiting
Fig 2 | Determining fit-for-purpose data sources (step 2b of the process guide for inferential studies using healthcare data from routine clinical practice). glycated hemoglobin; electronic health records. *Quality=accuracy with respect to timing and completeness for treatments; positive predicted value, sensitivity, specificity for binary outcomes; proportion missing for continuous outcomes; accurate onset for time to event outcomes; and availability of long term follow-up data for latent outcomes
the analysis to individuals with linked data from insurance claims and electronic health records available and a pre-treatment measurement of the eligibility criteria might be needed to prevent bias at the expense of transportability.
  • Question 2: Is the outcome of interest measured with sufficient quality?
    The quality of outcome measurement depends on positive predicted value for binary outcomes, proportion missing for continuous outcomes, and accurate onset for time-to-event outcomes. Typically, serious medical conditions (eg, stroke) might be adequately recorded in insurance claims ; but other outcomes are not, including those that require confirmatory laboratory test results (eg, acute pancreatitis ) or contextual information from free text notes (eg, suicidal ideation ). For such outcomes, data augmentation through linkage of insurance claims with electronic health records is required.
Outcome-identifying algorithms (including those using only claims based information) can be developed, improved, and validated based on chart reviews using linked electronic health records. If an algorithm using only claims based information shows acceptable performance, such an algorithm can be applied to the larger insurance claims data source. In cases where claims based algorithms are insufficient but electronic health record sources provide sufficient augmentation to identify the outcome, researchers could consider restricting their population to patients with claims-electronic health records linked records. Judgments on the quality required for an algorithm to be considered sufficient for use in inference can be subjective; however, implementing a simplified rule on performance parameters (eg, positive predicted value) might not be helpful. Whether to proceed with the analysis is a multifaceted decision and considers factors such as the urgency of information needed
and the severity of the adverse event. Knowing the measurement characteristics through validation in linked electronic health records, even when they are suboptimal, will enable quantitative bias analysis. More details on quantitative bias analysis are given below in step 4. In analyses that go across a network of databases, the transportability of measurement algorithms and the measurement qualities across databases might need to be demonstrated.
  • Question 3: Is the treatment measured with sufficient quality?
    Quality of measurement for a particular treatment refers to the accuracy of recording in insurance claims data with respect to the timing and completeness. For many products such as outpatient prescription drug treatments, insurance claims are generally sufficient to capture treatment through outpatient pharmacy dispensing records. However, an example treatment that is often insufficiently recorded in claims is blood transfusion products. In such circumstances, alternate data sources that have information on inpatient administrations are needed to answer the research question. If dynamic treatment strategies are being compared, the time-varying clinical factors used to define the strategies over time should also be available.
  • Question 4: Are key confounders recorded?
If a strong confounder is not adequately measured in insurance claims, data augmentation with electronic health records or laboratory test results might need to be considered. For example, baseline glycated hemoglobin test results for a study comparing two glucose-lowering drug treatments with respect to an adverse outcome might require augmentation. Added information on confounders achieved through augmentation might be useful to assess the potential for uncontrolled confounding, and for performing additional analyses such as statistical calibration of the study results to incorporate knowledge about unmeasured confounders.
Data sources meet the basic criteria for relevance, potentially through various augmentation strategies if needed, when they provide explicitly characterized eligibility criteria, primary outcomes, treatment, and key confounders. Additionally, initial feasibility assessment of the number of patients potentially available for the study might be needed to ensure relevance. For example, such assessments could include an initial evaluation of the number of new users of study drug treatments of interest in the data source(s) being considered.
The second aspect for fitness-for-purpose of a data source is data reliability, which includes assessments of accuracy, completeness, provenance, and traceability of the source data (fig 2). Within Sentinel, these evaluations are performed upstream when converting
raw data from contributing sources to the Sentinel common data model-which is then used for all subsequent analyses. Data sources that meet both relevance and reliability criteria can be considered fit for purpose for the study question of interest.
If emulation of each component of the target trial protocol is not feasible with the data source being considered, investigators can reassess the question in step 1 by specifying a modified target trial protocol that requires a different set of data elements while still asking a causal question of interest. Investigators are encouraged to record all assessments of data relevance and data reliability to trace key design decisions leading to selection of fit-for-purpose data that can support the corresponding trial emulation.
If emulation of each component of the target trial protocol is feasible with the data source being considered, investigators should consider registration of the study protocol at this stage before proceeding with assessment of expected precision and diagnostic evaluations (step 3). An alternative to protocol registration is publication of the target trial protocol along with the annotated computer code while making the data available to interested investigators whenever feasible. Pre-registration of protocols and data sharing agreements can serve as deterrent to data dredging, which is a common concern with analyses of healthcare data.
For the case example study, demographics (age, sex, race, socioeconomic status markers); variables related to diabetes severity including microvascular and macrovascular complications; measures related to diabetes control such as , comorbid conditions, co-treatments, markers for healthy behavior, and healthcare use were considered confounders owing to their likely association with treatment choice and outcome risk. We describe the emulation of each component of the target trial protocol by providing a precise description of the operationalization of variable definitions, including all codes and algorithms, using the HARPER template (web appendix 2). For statistical analysis, we estimated the hazard ratio (averaged over the follow-up period) via a Cox model adjusted for baseline confounding with propensity score stratification and weighting, as in previous studies with low incidence of treatment initiation and rare safety outcomes. Other adjustment methods, such as parametric g formula or inverse probability weighting, might be required when emulating trials with sustained treatment strategies and thus with time-varying treatments. We also specified analyses in groups stratified by sex, age, and baseline risk factors for infections as subgroup analyses of interest to evaluate potential effect measure modification by these characteristics.
Appendix figure 1 answers questions 1-4 to provide clarity on likely fit-for-purpose data for our case example. Briefly, outcome and treatment are well captured in Medicare claims; however, linkage to electronic health records could be important to ascertain clinical factors that are used as eligibility
criteria or confounders. In this case example, we used US Medicare Fee For Service claims data from parts A, B, that are deterministically linked by health insurance claim numbers, date of birth, and sex (linkage success rate ) to electronic health records from the Mass General Brigham healthcare system in Boston.

Step 3: Assess expected precision and conduct diagnostic evaluations

After clearly specifying all design choices and registering a study protocol, the next important design component is assembling the study population using all eligibility criteria to assess expected precision and to conduct diagnostic evaluations. These evaluations could allow for principled study adaptations, yet little formal guidance exists regarding this activity. We fill this gap by outlining a systematic approach in figure 3.
  • Step 3a: Assess expected precision
For emerging safety signals where effect size is likely not known, the decision to proceed with analyses should depend on the importance of the information gained from a public health perspective. However, during the planning phase, it might be helpful to gauge the expected precision based on the selected data source and design choices to determine if adjustments are needed to achieve desired level of precision.
Based on the outcome counts and sizes of two treatment groups, researchers can estimate the variance of the log risk ratio using well known formulas and assumptions about the magnitude of the risk ratio. We provide an function to estimate expected precision based on sizes of two treatment groups and combined outcome counts across two groups as supplemental material (web appendix 3).
  • Step 3b: Diagnostic evaluations
Diagnostic evaluations are key components of non-interventional studies because they can alert researchers to potential violations of the core assumptions of causal inference. For instance, examining distribution of baseline characteristics in treatment groups being compared is an important diagnostic to detect positivity violations. Evaluating average length of time during which patients adhere to their assigned treatment strategies and examining characteristics of patients who deviate from the treatment strategies could alert researchers to the possibility of informative censoring, which could threaten exchangeability. Other analysis specific diagnostic criteria might also be helpful. For instance, when using analyses based on propensity scores, evaluating baseline covariate balance after
Fig 3 | Assessing expected precision and conducting diagnostic evaluations (step 3 of the process guide for inferential studies using healthcare data from routine clinical practice). PS=propensity score
conditioning on the propensity score could serve as a diagnostic for model misspecification. If inverse probability weighting is used to adjust for informative censoring or time-varying confounding, evaluating distribution of weights over time could serve as a diagnostic for weight model misspecification. For analysis specific diagnostics, refining modelling choices could lead to resolution of issues.
If the assessment indicates lower than desirable precision or diagnostic evaluations indicate violations of core causal inference assumptions that cannot be resolved by refining modelling choices, investigators can consider going back to step 2 and changing some design choices, such as eligibility criteria or choice of the comparator group, before proceeding. This suggestion is analogous to an amendment of the study protocol that is common in prospective randomized trials in response to extraneous factors such as recruiting challenges. Similar to the guidance regarding protocol amendments for prospective trials, reasons for changes in the protocol of noninterventional studies using secondary healthcare data need to be clearly documented, as well as any changes in the causal contrasts that result from protocol changes. To maintain analyst blinding with respect to the treatment and outcome association and study integrity, researchers should also ensure that protocol amendments are not introduced in response to inferential analysis (step 5).
For our case example in step 3a, the expected 95% confidence interval under an assumed null effect on the relative scale (1.0) of SGLT-2 inhibitors on the risk of genital infections was 0.35 to 1.65 . This result is imprecise because only 1498 patients with only 40 outcomes were eligible for analysis. Because the low sample size is partly due to the inclusion criterion of test results before initiation of drug treatment (appendix fig 2), we could go back to step 2 and consider relaxing this inclusion criterion, which would increase the number of eligible individuals to 9339 (293 events) with a 95% confidence interval of 0.73 to 1.27 . However, relaxing this criterion makes the assumption that not adjusting for in the main analysis does not introduce major confounding bias. Appendix table 1 provides a revised target trial table highlighting the one protocol change prompted by assessment of expected precision.
For step 3b, we used this cohort of 9339 patients meeting eligibility criteria per the amended protocol. We estimated the probability of initiating SGLT-2 inhibitors versus DPP-4 (dipeptidyl peptidase-4) inhibitors given baseline patient characteristics (ie, the propensity score) using multivariable logistic regression models, created 50 stratums based on the distribution of propensity scores in patients receiving SGLT-2 inhibitor treatment, and weighted DPP-4 inhibitor initiators proportional to the distribution of SGLT-2 inhibitor initiators in the propensity score stratum into which they fell. As diagnostics for propensity score models,
we evaluated distributional overlap (appendix fig 3), weight distribution (appendix fig 4), and covariate balance using standardized differences post-weighting (appendix tables 2 and 3). SAS macros used to conduct the analysis and generate diagnostic figures are publicly available. All SAS codes are also posted on https://dev.sentinelsystem.org/projects/IC/repos/ ic_ci2_principled/browse.

Step 4: Develop a plan for robustness assessments including deterministic sensitivity analyses, probabilistic sensitivity analyses, and net bias evaluation

Robustness assessments deal with the consistency of evidence with respect to alternative investigator decisions related to study design, measurement, or analysis. As the fourth and final step of study planning, we propose prespecification of robustness assessments. After assessing precision and diagnostic evaluations, investigators probably have additional understanding of the potential threats to the study and can make informed judgments related to the need for specific robustness evaluations. Such prespecified assessments are most useful if they have a clear rationale regarding the specific types of bias they address. Robustness assessments can be broadly categorized into three types, which are detailed below (fig 4).
  • Step 4a: Deterministic sensitivity analyses
Deterministic sensitivity analyses, also known as deterministic quantitative bias analysis, can be viewed as variations of the target trial protocol, where investigators focus on specific design or analytical assumptions and vary them individually to gauge the impact of specific assumptions or design choices on study results. Deterministic sensitivity analysis could focus on highly specific design or measurement choices, such as varying the outcome definition to increase the specificity and evaluate the possibility of bias due to outcome misclassification. They could also involve prespecification of alternate statistical analysis methods.
  • Step 4b: Probabilistic sensitivity analyses
Probabilistic sensitivity analyses, also known as probabilistic quantitative bias analysis, use various probabilistic and simulation approaches to evaluate the impact of various hidden biases on study results, including exposure/outcome misclassification, unmeasured confounders, and selection bias. Monte Carlo simulations evaluating potential bias require realistic ranges for bias parameters, for instance, sensitivity and specificity of an outcome identifying algorithm based on existing information such as validation studies. In those simulations, study results are recalculated for each run and then tabulated to provide empirical estimates of expected variation due to uncertainties in exposure or
Fig 4 | Robustness evaluations (step 4 of the process guide for inferential studies using healthcare data from routine clinical practice)
outcome identification. Similar bias modelling approaches are available to evaluate the impact of unmeasured confounders on study results based on the strength of association between the exposure and the suspected confounder as well as the outcome and the suspected confounder.
  • Step 4c: Net bias assessment
We use the term “net bias assessment” to describe the approaches that allow investigators to detect presence of bias from multiple sources such as uncontrolled confounding, selection bias, and measurement error. We describe two major types of such assessments.
Firstly, where possible, investigators should a priori identify and include control outcomes or control exposures that are known to have no associations (negative controls) or well established associations (positive controls) with either the exposure or outcome of interest. Ideally, these control variables will have confounding structure or mechanism of measurement error similar to the effect targeted for study. Inability to replicate the known effect sizes in these analyses could alert investigators to the presence of bias.
Secondly, when a well conducted randomized trial exists for the comparison under investigation with a different primary endpoint or conducted within a more restrictive population, benchmarking or trial calibration might be pursued. If investigators are able to replicate results for the primary outcome of such a trial in their data source by using identical inclusion and exclusion criteria and other design elements, it could increase confidence in results under a modified target trial protocol.
We recommend that investigators add expected precision assessment and diagnostic evaluations
along with prespecified robustness assessments as amendments to the registered protocol before moving on to step 5. If assessment of expected precision and diagnostic evaluations, which explicitly do not allow any inferential analyses, lead to any meaningful adaptations in the design or measurement, all such changes should also be documented as amendments to the registered protocol before starting the inferential analyses.
For our case example, we specified a deterministic sensitivity analysis (step 4a) to evaluate the impact of outcome misclassification. We defined the outcome after excluding non-specific codes of balanitis and balanoposthitis in male patients and vaginitis and vulvovaginitis in female patients and focusing solely on candida of urogenital sites.
We also specified a quantitative bias analysis (step 4b). To explore the impact of our assumption that is not an important confounder, we used data in a subset of patients to inform this analysis. Information regarding the distribution of in our linked subset and the association between the unmeasured confounder and outcome (infections) based on prior epidemiological research were used as inputs to calculate adjusted estimates over a range of bias parameters.
Finally, we specified a net bias analysis (step 4c), by assessing hospital admission for heart failure as a positive control outcome. SGLT-2 inhibitors have an established association with a reduced risk of hospital admission for heart failure. This association has been observed consistently across randomized controlled trials including CANVAS, CREDENCE, DAPA-HF, DECLARE-TIMI-58, EMPAREG OUTCOME, EMPERORREDUCED, and VERTIS-CV. If the set of controlled covariates is sufficient to control confounding (without introducing bias) for both of the outcomes (genital infection and hospital admission for heart failure), a
Variable Events/person years
SGLT-2 DPP-4 inhibitors inhibitors Hazard ratio (95% CI) Hazard ratio (95% CI)
Primary analysis
Full cohort 123/1553 170/5785 2.68 (1.86 to 3.86)
Male sex 41/912 54/2781 2.32 (1.21 to 4.46)
Female sex 82/620 134/3055 3.00 (2.08 to 4.32)
Age <75 years 77/1026 77/2755 2.69 (1.84 to 3.93)
Age years 44/500 81/3068 3.32 (2.04 to 5.41)
With history of infection risk factors 67/655 80/2821 3.60 (2.48 to 5.23)
Without history of infection risk factors 56/886 90/2910 2.04 (1.07 to 3.91)
Robustness evaluations
Sensitivity analysis: more specific outcome definition 47/1596 68/5826 2.51 (1.54 to 4.11)
QBA: correcting for unmeasured 2.63 (1.82 to 3.78)
Positive control outcome: heart failure hospital admission 23/1612 149/5785 0.55 (0.34 to 0.91)
0.5 1 4 8
Fig 5 | Results from the primary analysis, subgroup analyses, and robustness evaluations for the case example study evaluating the effect of sodiumglucose cotransporter-2 (SGLT-2) inhibitors on genital infections. The quantitative bias analysis (QBA) presents adjusted results at the values of bias parameters observed in ancillary data ( uncontrolled hyperglycemia as defined by glycated hemoglobin ( ) ) in reference group and odds ratio of 1.3 for receipt of SGLT-2 inhibitor treatment). Appendix figure 5 provides results from this quantitative bias analysis over various combinations of bias parameters
finding of robust adjusted association between the exposure and known positive control outcome can provide some reassurance in the observed findings for the genital infection outcome.

Step 5: Inferential analysis

At the end of step 4, all key design elements, measurements, and data analysis plan are prespecified, and inferential data analysis can proceed. The central idea behind structuring the steps in this sequence with a clear demarcation between planning and inference is to avoid design or analysis changes prompted by study results. At the conclusion of inferential analysis and all prespecified robustness evaluations, investigators are well positioned to make sound inferences about the association under investigation.
For our case example study, results are presented in figure 5, which showed a consistently elevated risk of genital infections after initiating SGLT-2 inhibitors versus DPP-4 inhibitors in patients with diabetes across all subgroups and all robustness evaluations. Appendix figure 5 summarizes the quantitative bias analysis for uncontrolled confounding by over a range of bias parameters, which indicated that the risk of genital infections with SGLT-2 inhibitors remained elevated even in extreme scenarios of uncontrolled confounding. In net bias analysis, we observed a robust reduction in the risk of the positive control outcome (hospital admission for heart failure), which was expected. Overall, results indicating potentially a greater risk of genital infections with SGLT-2 inhibitors are in line with prior observations from trials and observational studies. In a large meta-analysis of eight phase 3 randomized trials, the pooled relative risk for genital infections was reported to be 3.75 ( confidence interval 3.00 to 4.67 ). A previous analysis
of US commercial insurance claims reported about a threefold increased risk of genital infections with SGLT-2 inhibitors versus DPP-4 inhibitors.

Conclusion

This report introduces a stepwise process that systematically considers key decision nodes for evaluating causal effects of treatments using healthcare data. The process outlined in this framework can facilitate transparent communications between various stakeholders and motivate critical considerations for the clinical research community.

AUTHOR AFFILIATIONS

Division of Pharmacoepidemiology and Pharmacoeconomics, Department of Medicine, Brigham and Women’s Hospital, Harvard Medical School, Boston, MA 02120, USA
Kaiser Permanente Washington Health Research Institute, Seattle, WA, USA
Department of Biostatistics, University of Michigan, Ann Arbor, MI, USA
Department of Population Medicine, Harvard Medical School and Harvard Pilgrim Health Care Institute, Boston, MA, USA
US Food and Drug Administration, Silver Spring, MD, USA
Department of Medicine, Johns Hopkins University School of Medicine, Baltimore, MD, USA
Departments of Epidemiology and Biostatistics, and Medicine, McGill University, Montreal, QC, Canada
Boston University School of Public Health, Boston, MA, USA
Department of Epidemiology and Department of Statistics, University of California, Los Angeles, CA, USA
CAUSALab and Departments of Epidemiology and Biostatistics, Harvard TH Chan School of Public Health, Boston, MA, USA
Department of Biostatistics, University of Washington, Seattle, WA, USA
Contributors: RJD, SVW, ST, JCN, SS, SD, RB, and GDP have leadership roles in the FDA’s Sentinel initiative, which is the national active postmarketing surveillance system for medical products in the US. All other authors are invited experts from academia or FDA with many years of combined experience in development of methods informing conduct of non-interventional studies. Coauthors from the
US Food and Drug Administration (FDA) participated in the results interpretation and in the preparation and decision to submit the manuscript for publication.The authors were brought together as a workgroup supported by the FDA Sentinel Innovation Center. The workgroup held 12 teleconference calls between June 2021 and December 2022, which were attended by authors (RJD, SVW, SKS, LZ, FK-K, JCN, XS, ST, RW, EP, SD, JL, HL, RB, GDP, JBS, SS, KJR, SG, MAH, PJH, and SS) to discuss the process and reach a consensus. RJD, SKS, LZ, and FKK conducted the data analysis for the case example study. RJD is the guarantor of the content of this article. The corresponding author attests that all listed authors meet authorship criteria and that no others meeting the criteria have been omitted.
Funding: This project was supported by Master Agreement 75F40119D10037 from the FDA. The FDA approved the study protocol used in the illustrative example shown in web appendix 2, including statistical analysis plan and reviewed and approved this manuscript. The FDA had no role in data collection, management, or analysis. The views expressed are those of the authors and not necessarily those of the FDA.
Competing interests: All authors have completed the ICMJE uniform disclosure form at www.icmje.org/disclosure-of-interest/ and declare: support from the FDA for the submitted work. RJD reports serving as principal investigator on investigator initiated grants to the Brigham and Women’s Hospital from Novartis, Vertex, and Bayer on unrelated projects. SS is co-principal investigator of an investigator initiated grant to the Brigham and Women’s Hospital from Boehringer Ingelheim unrelated to the topic of this study, and is a consultant to Aetion, a software manufacturer of which he owns equity; his interests were declared, reviewed, and approved by the Brigham and Women’s Hospital and Mass General Brigham HealthCare System in accordance with their institutional compliance policies. RB is an author on US Patent 9075796 (on text mining for large medical text datasets and corresponding medical text classification using informative feature selection), which at present is not licensed and does not generate royalties. JCN reports research funding from Moderna for service on their safety monitoring committee.
Provenance and peer review: Not commissioned; externally peer reviewed.
1 Concato J, Corrigan-Curay J. Real-World Evidence – Where Are We Now? N Engl / Med 2022;386:1680-2. doi:10.1056/ NEJMp2200089
2 Food and Drug Administration. Best Practices for Conducting and Reporting Pharmacoepidemiologic Safety Studies Using Electronic Healthcare Data Sets. 2013. https://www.fda.gov/regulatory-information/search-fda-guidance-documents/best-practices-conducting-and-reporting-pharmacoepidemiologic-safety-studies-using-electronic.
3 European Network of Centres for Pharmacoepidemiology and Pharmacovigilance. ENCePP Guide on Methodological Standards in Pharmacoepidemiology. 2022 https://www.encepp.eu/standards_ and_guidances/methodologicalGuide.shtml.
4 Sterne JA, Hernán MA, Reeves BC, et al. ROBINS-I: a tool for assessing risk of bias in non-randomised studies of interventions. BMJ 2016;355:i4919. doi:10.1136/bmj.i4919
5 Dreyer NA, Bryant A, Velentgas P. The GRACE checklist: a validated assessment tool for high quality observational studies of comparative effectiveness. J Manag Care Spec Pharm 2016;22:1107-13. doi:10.18553/jmcp.2016.22.10.1107
6 Langan SM, Schmidt SA, Wing K, et al. The reporting of studies conducted using observational routinely collected health data statement for pharmacoepidemiology (RECORD-PE). BMJ 2018;363:k3532. doi:10.1136/bmj.k3532
7 Wang SV, Pinheiro S, Hua W, et al. STaRT-RWE: structured template for planning and reporting on the implementation of real world evidence studies. BMJ 2021;372:m4856. doi:10.1136/bmj.m4856
8 Wang SV, Pottegård A, Crown W, et al. HARmonized Protocol Template to Enhance Reproducibility of hypothesis evaluating real-world evidence studies on treatment effects: A good practices report of a joint ISPE/ISPOR task force. Value Health 2022;25:1663-72. doi:10.1016/j.jval.2022.09.001
9 Berger ML, Sox H, Willke RJ, et al. Good practices for real-world data studies of treatment and/or comparative effectiveness: Recommendations from the joint ISPOR-ISPE Special Task Force on real-world evidence in health care decision making. Pharmacoepidemiol Drug Saf 2017;26:1033-9. doi:10.1002/ pds. 4297
10 Orsini LS, Berger M, Crown W, et al. Improving Transparency to Build Trust in Real-World Secondary Data Studies for Hypothesis Testing-Why, What, and How: Recommendations and a Road Map from the Real-World Evidence Transparency Initiative. Value Health 2020;23:1128-36. doi:10.1016/j.jval.2020.04.002
11 Schuemie MJ, Ryan PB, Pratt N, et al. Principles of large-scale evidence generation and evaluation across a network of databases (LEGEND). / Am Med Inform Assoc 2020;27:1331-7. doi:10.1093/jamia/ocaa103
12 Dang LE, Gruber S, Lee H, et al. A causal roadmap for generating high-quality real-world evidence. J Clin Transl Sci 2023;7:e212. doi:10.1017/cts.2023.635
13 Ball R, Robb M, Anderson SA, Dal Pan G. The FDA’s sentinel initiative–A comprehensive approach to medical product surveillance. Clin Pharmacol Ther 2016;99:265-8. doi:10.1002/cpt. 320
14 Food and Drug Administration. FDA warns about rare occurrences of a serious infection of the genital area with SGLT2 inhibitors for diabetes. 2018. https://www.fda.gov/drugs/drug-safety-and-availability/fda-warns-about-rare-occurrences-serious-infection-genital-area-sglt2-inhibitors-diabetes.
15 Hernán MA. The C-word: scientific euphemisms do not improve causal inference from observational data. Am J Public Health 2018;108:616-9. doi:10.2105/AJPH.2018.304337
16 E9(R1) Statistical Principles for Clinical Trials. Addendum: Estimands and Sensitivity Analysis in Clinical Trials. 2022. https://www.fda. gov/regulatory-information/search-fda-guidance-documents/ e9r1-statistical-principles-clinical-trials-addendum-estimands-and-sensitivity-analysis-clinical
17 Hernán MA, Robins JM. Using Big Data to Emulate a Target Trial When a Randomized Trial Is Not Available. Am I Epidemiol 2016;183:75864. doi:10.1093/aje/kwv254
18 Dickerman BA, García-Albéniz X, Logan RW, Denaxas S, Hernán MA. Emulating a target trial in case-control designs: an application to statins and colorectal cancer. Int J Epidemiol 2020;49:1637-46. doi:10.1093/ije/dyaa144
19 Hernán MA, Hernández-Díaz S, Werler MM, Mitchell AA. Causal knowledge as a prerequisite for confounding evaluation: an application to birth defects epidemiology. Am / Epidemiol 2002;155:176-84. doi:10.1093/aje/155.2.176
20 Tennant PWG, Murray EJ, Arnold KF, et al. Use of directed acyclic graphs (DAGs) to identify confounders in applied health research: review and recommendations. Int J Epidemiol 2021;50:620-32. doi:10.1093/ije/dyaa213
21 VanderWeele TJ. Principles of confounder selection. Eur J Epidemiol 2019;34:211-9. doi:10.1007/s10654-019-00494-6
22 Schneeweiss S, Rassen JA, Brown JS, et al. Graphical depiction of longitudinal study designs in health care databases. Ann Intern Med 2019;170:398-406. doi:10.7326/M18-3079
23 Food and Drug Administration. Sentinel Initiative. 2022. https://www. sentinelinitiative.org/about/key-database-statistics
24 Desai RJ, Matheny ME, Johnson K, et al. Broadening the reach of the FDA Sentinel system: A roadmap for integrating electronic health record data in a causal analysis framework. NPJ Digit Med 2021;4:170. doi:10.1038/s41746-021-00542-0
25 Food and Drug Administration. Real-World Data: Assessing Electronic Health Records and Medical Claims Data To Support Regulatory Decision-Making for Drug and Biological Products Guidance for Industry. 2021. fda.gov/regulatory-information/search-fda-guidance-documents/real-world-data-assessing-electronic-health-records-and-medical-claims-data-support-regulatory.
26 Desai RJ, Lin KJ, Patorno E, et al. Development and preliminary validation of a Medicare claims-based model to predict left ventricular ejection fraction class in patients with heart failure. Circ Cardiovasc Qual Outcomes 2018;11:e004700. doi:10.1161/ CIRCOUTCOMES.118.004700
27 Bhatt AS, Vaduganathan M, Zhuo M, Fu EL, Solomon SD, Desai RJ. Risk of Acute Kidney Injury Among Older Adults With Heart Failure and With Reduced Ejection Fraction Treated With AngiotensinNeprilysin Inhibitor vs Renin-Angiotensin System Inhibitor in Routine Clinical Care. J Card Fail 2023;29:138-46. doi:10.1016/j. cardfail.2022.09.004
28 Desai RJ, Solomon SD, Vaduganathan M. Rates of Spironolactone Initiation and Subsequent Hyperkalemia Hospitalizations in Patients with Heart Failure with Preserved Ejection Fraction Following the TOPCAT trial: A Cohort Study of Medicare Beneficiaries. J Card Fail 2022;28:1035-9. doi:10.1016/j.cardfail.2022.01.012
29 Wahl PM, Rodgers K, Schneeweiss S, et al. Validation of claimsbased diagnostic and procedure codes for cardiovascular and gastrointestinal serious adverse events in a commercially-insured population. Pharmacoepidemiol Drug Saf 2010;19:596-603. doi:10.1002/pds. 1924
30 Floyd JS, Bann MA, Felcher AH, et al. Validation of acute pancreatitis among adults in an integrated healthcare system. Epidemiology 2023;34:33-7. doi:10.1097/EDE. 0000000000001541
31 Fernandes AC, Dutta R, Velupillai S, Sanyal J, Stewart R, Chandran D. Identifying suicide ideation and suicidal attempts in a psychiatric clinical research database using natural language processing. Sci Rep 2018;8:7426. doi:10.1038/s41598-018-25773-2
32 Lash TL, Fox MP, MacLehose RF, Maldonado G, McCandless LC, Greenland S. Good practices for quantitative bias analysis. Int/ Epidemiol 2014;43:1969-85. doi:10.1093/ije/dyu149
33 Sentinel Initiative. Expansion of the US FDA Sentinel System to inpatient blood transfusion data from Hospital Corporation of America: new surveillance options. 2017. https://www. sentinelinitiative.org/sites/default/files/Sentinel-ICPE-2017-Presentation-HCA-Data-Exploration.pdf
34 Cain LE, Robins JM, Lanoy E, Logan R, Costagliola D, Hernán MA. When to start treatment? A systematic approach to the comparison of dynamic regimes using observational data. Int I Biostat 2010;6:18. doi:10.2202/1557-4679.1212
35 Schneeweiss S. Sensitivity analysis and external adjustment for unmeasured confounders in epidemiologic database studies of therapeutics. Pharmacoepidemiol Drug Saf 2006;15:291-303. doi:10.1002/pds. 1200
36 Stürmer T, Schneeweiss S, Avorn J, Glynn RJ. Adjusting effect estimates for unmeasured confounding with validation data using propensity score calibration. Am J Epidemiol 2005;162:279-89. doi:10.1093/aje/kwi192
37 Sentinel Operations Center. Sentinel Data Quality Assurance Practices. 2017. https://www.sentinelinitiative.org/sites/default/files/data/ distributed-database/Sentinel_DataQAPractices_Memo.pdf
38 Smith GD, Ebrahim S. Data dredging, bias, or confounding, They can all get you into the BMJ and the Friday papers. BMJ 2002;325:14378. doi:10.1136/bmj.325.7378.1437
39 Desai RJ, Rothman KJ, Bateman BT, Hernandez-Diaz S, Huybrechts KF. A propensity-score-based fine stratification approach for confounding adjustment when exposure is infrequent. Epidemiology 2017;28:24957. doi:10.1097/EDE. 0000000000000595
40 Desai RJ, Franklin JM. Alternative approaches for confounding adjustment in observational studies using weighting based on the propensity score: a primer for practitioners. BMJ 2019;367:15657. doi:10.1136/bmj.l5657
41 Patorno E, Huybrechts KF, Bateman BT, et al. Lithium use in pregnancy and the risk of cardiac malformations. NEngl) Med 2017;376:2245-54. doi:10.1056/NEJMoa1612222
42 Smith LH, García-Albéniz X, Chan JM, et al. Emulation of a target trial with sustained treatment strategies: an application to prostate cancer using both inverse probability weighting and the g-formula. Eur) Epidemiol 2022;37:1205-13. doi:10.1007/s10654-022-00929-7
43 Hernán MA. Causal analyses of existing databases: no power calculations required. / Clin Epidemiol 2022;144:203-5. doi:10.1016/j.jclinepi.2021.08.028
44 Rothman KJ, Greenland S. Planning study size based on precision rather than power. Epidemiology 2018;29:599-603. doi:10.1097/ EDE. 0000000000000876
45 Zhu Y, Hubbard RA, Chubak J, Roy J, Mitra N. Core concepts in pharmacoepidemiology: Violations of the positivity assumption in the causal analysis of observational data: Consequences and statistical approaches. Pharmacoepidemiol Drug Saf 2021;30:1471-85. doi:10.1002/pds. 5338
46 Webster-Clark M, Stürmer T, Wang T, et al. Using propensity scores to estimate effects of treatment initiation decisions: State of the science. Stat Med 2021;40:1718-35. doi:10.1002/sim. 8866
47 Wyss R, Ellis AR, Brookhart MA, et al. The role of prediction modeling in propensity score estimation: an evaluation of logistic regression, bCART, and the covariate-balancing propensity score. Am / Epidemiol 2014;180:645-55. doi:10.1093/aje/kwu181
48 Cole SR, Hernán MA. Constructing inverse probability weights for marginal structural models. Am J Epidemiol 2008;168:656-64. doi:10.1093/aje/kwn164
49 Schulz KF, Altman DG, Moher D. CONSORT 2010 statement: Updated guidelines for reporting parallel group randomised trials. J Pharmacol Pharmacother 2010;1:100-7. doi:10.4103/0976-500X.72352
50 Austin PC. Using the standardized difference to compare the prevalence of a binary variable between two groups in observational research. Commun Stat Simul Comput 2009;38:122834doi:10.1080/03610910902859574.
51 Desai R. Propensity score fine stratification SAS macro. doi:10.7910/ DVN/U8JLCW. V5 ed: Harvard Dataverse, 2020.
52 Fox MP, Lash TL, Greenland S. A method to automate probabilistic sensitivity analyses of misclassified binary variables. Int / Epidemiol 2005;34:1370-6. doi:10.1093/ije/dyi184
53 Lash TL, Fox MP, Cooney D, Lu Y, Forshee RA. Quantitative bias analysis in regulatory settings. Am J Public Health 2016;106:122730. doi:10.2105/AJPH.2016.303199
54 Arnold BF, Ercumen A, Benjamin-Chung J, Colford JMJr. Brief report: negative controls to detect selection bias and measurement bias in epidemiologic studies. Epidemiology 2016;27:637-41. doi:10.1097/EDE. 0000000000000504
55 Lipsitch M, Tchetgen Tchetgen E, Cohen T. Negative controls: a tool for detecting confounding and bias in observational studies. Epidemiology 2010;21:383-8. doi:10.1097/ EDE.0b013e3181d61eeb
56 Khosrow-Khavar F, Kim SC, Lee H, Lee SB, Desai RJ. Tofacitinib and risk of cardiovascular outcomes: results from the Safety of TofAcitinib in Routine care patients with Rheumatoid Arthritis (STAR-RA) study. Ann Rheum Dis 2022;81:798-804. doi:10.1136/ annrheumdis-2021-221915
57 Matthews AA, Dahabreh IJ, Fröbert O, et al. Benchmarking observational analyses before using them to address questions trials do not answer: an application to coronary thrombus aspiration. Am I Epidemiol 2022;191:1652-65. doi:10.1093/aje/kwac098
58 Flanders WD, Khoury MJ. Indirect assessment of confounding: graphic description and limits on effect of adjusting for covariates. Epidemiology 1990;1:239-46. doi:10.1097/00001648-199005000-00010
59 Mor A, Dekkers OM, Nielsen JS, Beck-Nielsen H, Sørensen HT, Thomsen RW. Impact of glycemic control on risk of infections in patients with type 2 diabetes: a population-based cohort study. Am I Epidemiol 2017;186:227-36. doi:10.1093/aje/kwx049
60 Zelniker TA, Wiviott SD, Raz I, et al. SGLT2 inhibitors for primary and secondary prevention of cardiovascular and renal outcomes in type 2 diabetes: a systematic review and meta-analysis of cardiovascular outcome trials. Lancet 2019;393:31-9. doi:10.1016/S0140-6736(18)32590-X
61 Vaduganathan M, Docherty KF, Claggett BL, et al. SGLT-2 inhibitors in patients with heart failure: a comprehensive meta-analysis of five randomised controlled trials. Lancet 2022;400:757-67. doi:10.1016/S0140-6736(22)01429-5
62 Qiu M, Ding L-L, Zhang M, Zhou HR. Safety of four SGLT2 inhibitors in three chronic diseases: A metaanalysis of large randomized trials of SGLT2 inhibitors. Diab Vasc Dis Res 2021;18:14791641211011016. doi:10.1177/14791641211011016
63 Dave CV, Schneeweiss S, Patorno E. Comparative risk of genital infections associated with sodium-glucose co-transporter-2 inhibitors. Diabetes Obes Metab 2019;21:434-8. doi:10.1111/ dom. 13531
Web appendix 1: Appendix figures and tables Web appendix 2: Study protocol of case example study Web appendix 3: R function for step 3a (assess expected precision)